Measuring the energy consumption of software is far from being a trivial task. This article provides essential details about energy consumption tools, their configuration in various software systems, and associated pros and cons. Being able to measure and interpret energy data is one of the most important skills to create Green Software. Read on and let me know your thoughts!
Developing green software is the new tech skill that is becoming more and more important. The ambition to achieve climate neutrality is being set by many public- and private-sector leaders and it is evident that the tech sector has an important role here. Soon, every tech company will have to embrace the green digital transition and ensuring energy-efficient software is an essential part of this transition.
There are various ways to ensure green software – tracking its energy consumption is one of the ways but practitioners often find it hard to start in this direction. In this article, we are going to cover 7 different ways of measuring the energy consumption of your code. There is not a single approach since different platforms require different strategies. For example, some tools only work with Intel CPUs, other only work with a particular OS, and so on. Every time I want to measure energy consumption, I have to study a ton of different tools before I find the right power tool that works with my software system. This article will help you skip that part of the deal and start measuring energy right away!
Power Monitors vs Energy Profilers
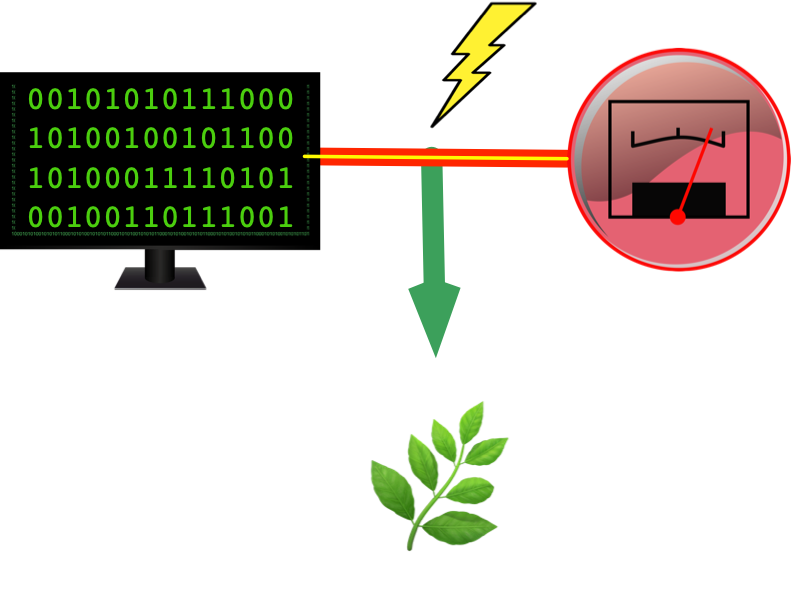
The most accurate strategy to measure energy consumption is using power monitors – hardware tools that connect to the power source of your device or component and measure the actual power leveraged at any instant of time. Despite being extremely precise, power monitors are also extremely difficult to set up. Often, they require you to make custom changes to your computer device.
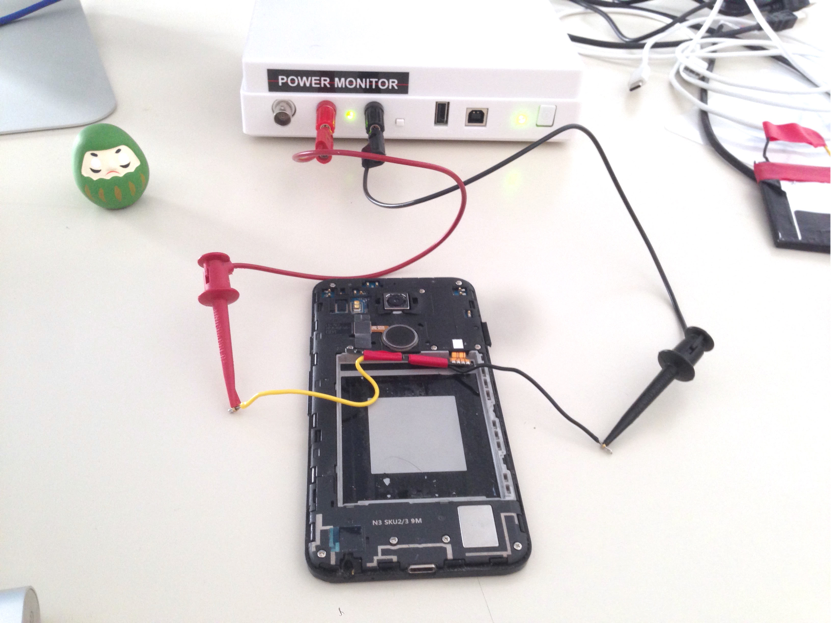
My setup to measure the energy consumption of Android apps using a power monitor device.
What’s more, you will need to find a way of time-syncing the power data with the execution of your software. Some power monitors are shipped with a software library that allows controlling the power monitor from your computer – starting, stopping, collecting measurements. The problem takes another level if you are working with a team of developers that should also run some energy tests in their local workstations. I have previously written about how to use a Power Monitor to measure energy consumption and is not easy at all: you have to do all sorts of hardware hacks before you can make reliable measurements.
But don’t give up just yet. Energy profilers have come to our rescue – they do not require any special hardware or fancy power sensors. They typically have an estimation model of the power cost of the different hardware components. Based on which components are active during execution, the profiler estimates a particular energy cost.
Energy profilers are usually shipped as easy-to-use tools that you can simply run from any device to get a final number: the total energy consumption. It is easy to time sync with your software execution: you start the profiler when you start the execution and you stop it when the execution ends.
Choosing the right energy profiler
Since energy profilers rely on estimations, they can only operate under very specific environments. Hence, there is no one-size-fits-all energy profiler and finding one that works for a given case is far from trivial.
Below I select a few energy profilers I have used in the past and I explain how to get started with them.
⚠️ Before we start
When measuring energy consumption, one cannot isolate the software from the system where it is running. Thus, it is extremely important that we reduce the extra work in your device to the bare minimum. Make sure that no unnecessary applications or processes are running on your device. Also, if you are running in a battery-powered device, it is usually recommended to remove the power plug as it might affect measurements in some setups.
1. Intel Power Gadget
📝 Works with Mac or Windows on Intel PCs. Download and Installation instructions: https://software.intel.com/content/www/us/en/develop/articles/intel-power-gadget.html
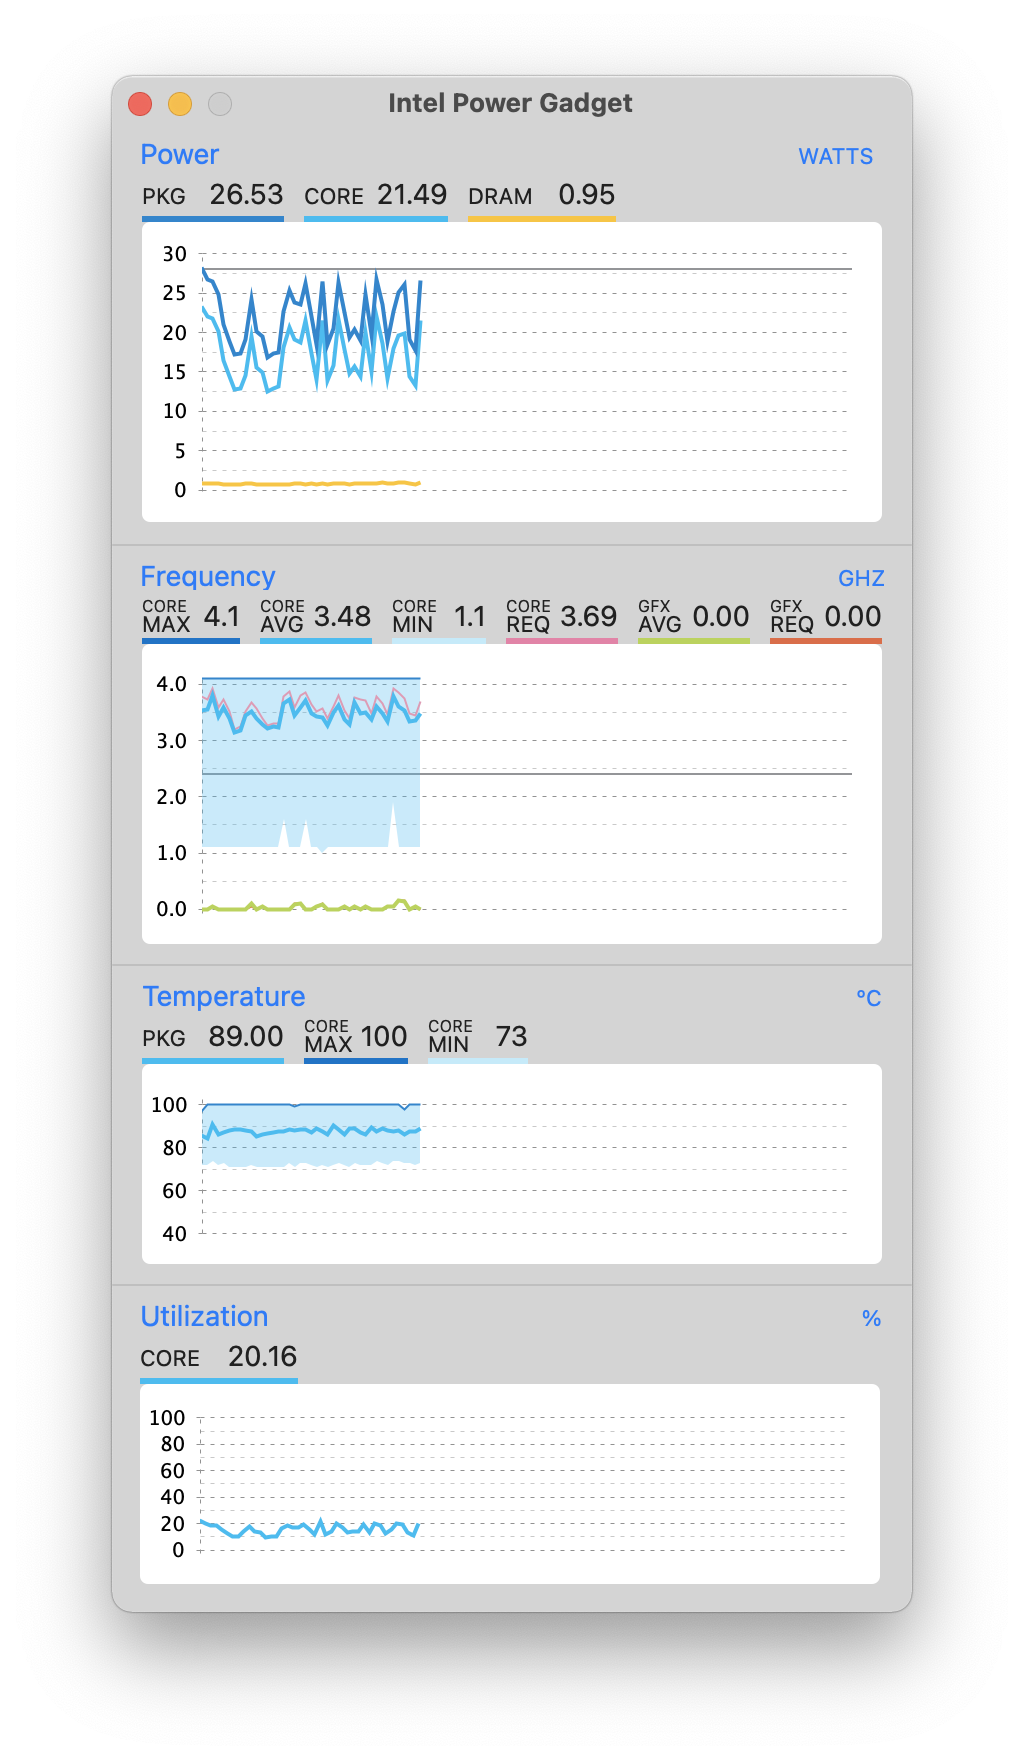
In my opinion, this is the easiest energy profiler one can use. It provides a graphical user interface with a few plots showing CPU utilisation (%), frequency (GHz), temperature (ºC), and power (W).
To collect the energy consumption you simply have to click on the menu Logging > Log to File to start measuring and another time to stop it.

The power data will be collected and stored in a CSV file under your Documents folder (default behaviour). I have run a small test and, in my case, it stored the data in the file ~/Documents/PwrData_2021-2-19_17-16-10.csv.
If you open the CSV file (you can use Excel, for example) you will find several columns. Some are straightforward – e.g., System Time, Elapsed Time (sec), Processor Power_0(Watt) – while others tend to be more complex – e.g., RDTSC and GT Requsted Frequency(MHz).
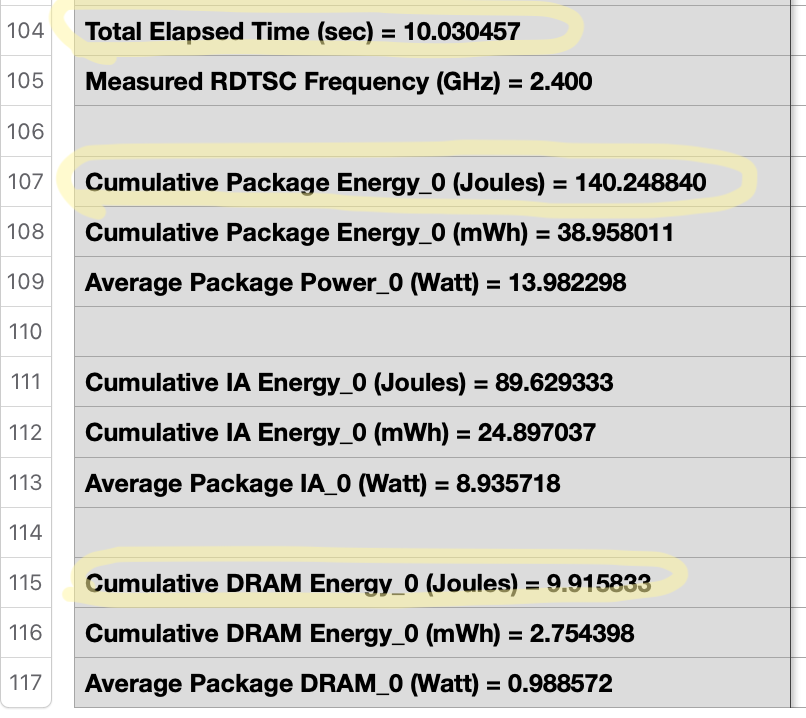
Let’s not worry too much about it. If you scroll all the way down to the bottom of the file, there is a summary table with a few important attributes:
- Total Elapsed Time (sec). The total time in seconds in which power data was being collected.
- Cumulative Package Energy_0 (Joules). The total energy consumption of the processor.
- Cumulative DRAM Energy_0 (Joules). The total energy consumption of the volatile memory.
Et voilà. You can do this whenever you are executing a particular use case of your software that you want to optimise. In my opinion, this is the easiest easy to get someone started in energy measurements. Its graphical user interface has a flat learning curve. However, if you want to create an automated script to measure the energy consumption of your software, clicking through menus is not ideal. As it turns out, the main strength of the Power Gadget is also its main weakness: the graphical interface is not suitable for automation. Hence, it is not the best tool if you want to create automated energy tests for your software project.
2. Intel PowerLog
📝 Works with Mac or Windows on Intel PCs.
When we install the Intel Power Gadget, a command-line interface tool is also installed: the PowerLog. To run it, first, we have to locate the tool inside the Power Gadget bundle. For example, on a Mac, you will probably find it under the /Applications directory: /Applications/Intel\ Power\ Gadget/PowerLog.
Hence, you can simply run it like this:
/Applications/Intel\ Power\ Gadget/PowerLog -file <RESULTS_FILE> -cmd <CMD>
where <RESULTS_FILE> is the name of the CSV file where the power data is stored and <CMD> is the actual command you want to execute. It could be, for example, your test script. For simplicity, try running a sleep command for a few seconds:
/Applications/Intel\ Power\ Gadget/PowerLog -file results.csv -cmd sleep 2
It will generate the CSV file results.csv that looks the exact same way as the Intel Power Gadget data above.
3. Powerstat
📝 Works with Linux on a compatible Intel PC. Manual pages.
If you are developing your software in a Linux environment, Intel Power Gadget and PowerLog are not the right energy profilers for you. Powerstat was developed by Colin King and it is the simplest tool I have come across to measure energy consumption on Linux. Here is how to use it.
First, install it using a suitable package manager. E.g., apt-get:
sudo apt-get install -y powerstat
Similar to the previous tools, powerstat is just another nice wrapper around an Intel library named RAPL, which stands for Running Average Power Limit. However, it provides a simple interface to execute it using the command line. You can run a power measurement with the following:
sudo powerstat -R 60 1
By default, it runs the measurement for 100 seconds (10 samples at 10-second intervals), but you can easily change that when calling the tool. In this case, we are measuring 60 samples at 1-second intervals.
The output consists of a table with several stats per sample. The table includes a column named Watts, which refers to the average power leveraged in each sample.
At the bottom of the output, powerstat yields a summary which, amongst other things, presents the average power of CPU in Watts. Example:
Summary:
CPU:   8.38 Watts on average with standard deviation 2.53
Note: power read from RAPL domains: package-0, uncore, package-0, dram, core, dram, psys.
These readings do not cover all the hardware in this device.
In this case, the summary tells us that the power consumption (different from energy consumption!) of the execution was on average \(8.38\text{W}\) in the 60 samples of 1 second. Based on this data, we can compute the total energy consumption.
⚠️ Always remember:
Power – measured in Watts – is different from energy consumption – measured in Joules. To compute the energy consumption (\(E\)), in Joules, you need to multiply the average power (\(P\)), in Watts, by the elapsed time in a given sample (\Delta t) in seconds:
\[E = P.\Delta t\]In this case, we ran the measurement for a total of 60 seconds. Hence, our total energy consumption is \(8.38\text{W} \times 60\text{s} = 502.8\text{J}\).
4. PowerTOP
📝 Official webpage. Available on Github. Works on Linux with AMD or Intel devices; also tested on virtual machines.
PowerTOP is another powerful tool to measure and monitor energy consumption. Its main advantage is the ability to estimate energy consumption in devices with an AMD processor. However, PowerTOP use cases go beyond simple energy consumption measurements. For example, it provides an interactive mode that allows users to fine-tune power management settings in their Linux system. Hence, it can sometimes be a bit overwhelming, but overall a great alternative.
Here is how I use PowerTOP:
sudo powertop --csv=output.csv -t 20
The --csv option prevents PowerTOP from entering the interactive mode and sets the output to be stored in the file output.csv. The option -t 20 sets that the measurement will run for 20 seconds.
Although the option --csv is set, the output is not exactly a CSV file. It rather includes a dull dump of text mixed with tables formatted in a “CSV-like” format. There are however tons of useful information in the output. For example, it includes a fine-grained estimation of the power consumption of each process in the system.
____________________________________________________________________
 *  *  *   Overview of Software Power Consumers   *  *  *

Usage;Wakeups/s;GPU ops/s;Disk IO/s;GFX Wakeups/s;Category;Description;PW Estimate
172.9 us/s; 24.9;;;;Timer;tick_sched_timer; 98.5 mW
296.0 us/s; 22.9;;;;Process;[PID 313728] /usr/bin/containerd ; 90.8 mW
 96.5 us/s; 16.2;;;;Process;[PID 11] [rcu_sched]; 64.2 mW
225.5 us/s; 14.1;;;;Process;[PID 313736] /usr/bin/containerd ; 56.0 mW
409.9 us/s; 12.3;;;;Process;[PID 361909] /usr/bin/vmtoolsd ; 49.4 mW
232.0 us/s; 12.1;;;;Process;[PID 313737] /usr/bin/containerd ; 48.3 mW
 24.5 us/s;  4.9;;;;kWork;fb_flashcursor; 19.4 mW
 21.4 us/s;  4.8;;;;kWork;vmw_fence_work_func; 19.0 mW
156.0 us/s;  3.9;;;;kWork;psi_avgs_work; 15.8 mW
309.8 us/s;  3.4;;;;kWork;vmw_fb_dirty_flush; 13.9 mW
 29.4 us/s;  3.3;;;;kWork;gc_worker; 13.1 mW
311.6 us/s;  1.7;;;;Timer;hrtimer_wakeup; 7.19 mW
 23.8 us/s;  1.2;;;;Interrupt;[17] ioc0; 4.97 mW
 39.7 us/s;  1.0;;;;Process;[PID 811] /usr/sbin/ntpd -p /var/run/ntpd.pid -g -u 113:117 ; 4.20 mW
 15.5 us/s;  1.0;;;;Timer;watchdog_timer_fn; 3.97 mW
  4.4 us/s;  1.0;;;;kWork;vmballoon_work; 3.95 mW
  6.0 us/s;  0.9;;;;kWork;mpt_fault_reset_work; 3.76 mW
 15.8 us/s;  0.8;;;;kWork;vmstat_shepherd; 3.38 mW
  1.1 ms/s; 0.15;;;;Process;[PID 377852] powertop --csv=output.csv -t 20 ; 2.33 mW
[...]
For the sake of simplicity, let’s focus on the main thing we want to collect – i.e., energy consumption. In the file, under the table entitled Overview of Software Power Consumers, there is a line with the following:
The system baseline power is estimated at: 5.43 W;
This means that, on average, our processor and main memory leveraged 5.43W of power during the 20 seconds of execution. As mentioned before, this is not the energy consumption (yet!). The total energy consumption in this measurement is computed by multiplying the average power by the duration of the measurement:
\[E = P.\Delta t = 5.43\text{W} \times 20\text{s} = 108.6\text{J}\]PowerTOP is a powerful tool and its potential goes beyond a simple measurement of energy consumption. This is especially true when it is run on battery-powered devices. Nevertheless, this is the simplest use case to get you started. If you want to delve into it, check out the user manual available on PowerTOP’s webpage.
5. Perf
📝 Official webpage. Works on Linux with Intel devices; does not work on virtual machines.
A very quick and easy way to obtain the energy consumption of a program in a Linux environment, is through Perf. Perf is a command-line tool that offers a wrapper to Intel’s RAPL. It facilitates the collection of energy measurements from various components of a computer system such as: cores, gpu (Intel’s GPUs), pkg (core and uncore components), psys (value is the entire system on chip), and ram.
First, install it using a suitable package manager. E.g., apt-get:
sudo apt install linux-tools-`uname -r`
You can fetch the energy consumption of an application/command with the following:
sudo perf stat -e power/energy-cores/,power/energy-ram/,power/energy-gpu/,power/energy-pkg/,power/energy-psys/ sleep 5
Then, Perf will provide the following output:
 Performance counter stats for 'system wide':

              3.59 Joules power/energy-cores/
              8.18 Joules power/energy-ram/
              1.63 Joules power/energy-gpu/
             12.74 Joules power/energy-pkg/
             51.10 Joules power/energy-psys/

       5.001965465 seconds time elapsed
In the above example we have measured the energy consumption of a Linux built-in command, sleep for 5 seconds.
However, any executable of any programming language can be measured.
Moreover, Perf offers the -r command-line argument that allows a user to specify how many times to measure an application.
sudo perf stat -r 5 -e power/energy-cores/ sleep 5
The above command will execute the sleep 5 command 5 times and report the average energy consumption,
and the difference of the measurements, in percentage.
 Performance counter stats for 'system wide' (5 runs):

              4.44 Joules power/energy-cores/        ( +- 1.52% )

          5.002405 +- 0.000272 seconds time elapsed  ( +-  0.01% )
In case you would like to avoid using the sudo each time you invoke Perf, then run the following commands in the terminal:
sudo sh -c 'echo -1 >/proc/sys/kernel/perf_event_paranoid'
sudo sysctl -w kernel.perf_event_paranoid=-1
Note that the above settings will not persist after restarting your system.
6. Likwid
📝 Official webpage. Works on Linux devices with Intel processor.
Another quick way of obtaining energy and power measurements from Intel processors, is through Likwid. At its heart, Likwid uses the RAPL interface, developed by Intel, to fetch energy and power measurements from different domains of a CPU.
First, clone the official repository and build as following:
git clone https://github.com/RRZE-HPC/likwid.git
cd likwid
make
sudo make install
Then, you may fetch energy and power measurements by executing the following command:
likwid-powermeter sleep 5
Then, likwid will provide you with the following output:
--------------------------------------------------------------------------------
CPU name:	Intel(R) Core(TM) i7-8565U CPU @ 1.80GHz
CPU type:	Intel Kabylake processor
CPU clock:	1.99 GHz
--------------------------------------------------------------------------------
--------------------------------------------------------------------------------
Runtime: 6.96028 s
Measure for socket 0 on CPU 0
Domain PKG:
Energy consumed: 24.9688 Joules
Power consumed: 3.58732 Watt
Domain PP0:
Energy consumed: 11.2714 Joules
Power consumed: 1.61939 Watt
Domain PP1:
Energy consumed: 2.91577 Joules
Power consumed: 0.418916 Watt
Domain DRAM:
Energy consumed: 11.8179 Joules
Power consumed: 1.6979 Watt
Domain PLATFORM:
Energy consumed: 77.1105 Joules
Power consumed: 11.0786 Watt
--------------------------------------------------------------------------------
Compared to Perf, Likwid does not offer an option such as -r to run a test mutliple of times.
However, it offers power apart form energy measurements.
Moreover, Likwid offers other options such as temperature monitoring per thread.
7. Nvidia-smi
📝 Official webpage. Works on Linux with Nvidia GPU devices; but never tested it on Windows.
A very easy to useful command-line tool to obtain Nvidia GPUs power-related information along with other information such as memory usage, temperature, and many more.
The nvidia-smi tool is particularly useful in measuring the power consumption of GPU-intensive applications such as training a deep learning model, watching a video, playing a game, and so on.
First, you have to find the available drivers of your GPU device using the suitable package manager (apt-get for our case):
apt search nvidia-driver
Based on the output of the above search command, select the latest tested proprietary version as it is the best fit. Then execute the following:
sudo apt update
sudo apt upgrade
apt install nvidia-[driver_number]
After restart your system and try to execute the nvidia-smi command in your terminal.
Once you get a similar output to the one below, then you are ready to measure an application’s GPU power consumption.
+-----------------------------------------------------------------------------+
| NVIDIA-SMI 470.57.02    Driver Version: 470.57.02    CUDA Version: 11.4     |
|-------------------------------+----------------------+----------------------+
| GPU  Name        Persistence-M| Bus-Id        Disp.A | Volatile Uncorr. ECC |
| Fan  Temp  Perf  Pwr:Usage/Cap|         Memory-Usage | GPU-Util  Compute M. |
|                               |                      |               MIG M. |
|===============================+======================+======================|
|   0  Quadro P400         On   | 00000000:01:00.0 Off |                  N/A |
| 34%   27C    P8    N/A /  N/A |      1MiB /  2000MiB |      0%      Default |
|                               |                      |                  N/A |
+-------------------------------+----------------------+----------------------+

+-----------------------------------------------------------------------------+
| Processes:                                                                  |
|  GPU   GI   CI        PID   Type   Process name                  GPU Memory |
|        ID   ID                                                   Usage      |
|=============================================================================|
|  No running processes found                                                 |
+-----------------------------------------------------------------------------+
You may start an application, let us say, to train a deep learning model and query information on the power usage of your GPU.
python trainDeepLearningModel.py &
nvidia-smi --loop-ms=1000 --format=csv --query-gpu=power.draw
The above commands will start a model train in the background and, then, will print the power usage
of the GPU in the foreground on each second (--loop-ms=1000).
The --format=csv can be used to collect data in a CSV format.
There are many available options to nvidia-smi and a rich documentation can be found online.
I know how to “get the Joules” – now what?
Interpreting the values of energy consumption is not a trivial thing to do. The simplest and most effective approach is by comparing the energy consumption of two different versions of your software during the same use case scenario:
- Create a reproducible scenario of the execution of your software. Preferably this should be an automated script – e.g., using a unit test framework.
- Execute the scenario in a version of your software. Use the energy profiler to measure the energy consumption.
- Improve your software in parts of the code that you suspect have low performance.
- Execute the same scenario with the new version. Compare the energy data in this version with the previous one.
With this analysis, you can already have an idea of how the energy efficiency of your software is evolving. You could even consider adding this analysis to your continuous integration pipeline.
However, even with this analysis, one could still argue that, given a scenario that costs 1, 10, 100, or 1000 Joules, it is not easy to say whether it is efficient or not. It is very difficult to define the exact threshold of energy efficiency. Yet, it is still relevant to understand the regression of the energy consumption of a given use case. It allows us to understand whether the software is evolving in the right direction.
Another relevant analysis is comparing the energy consumption of the different use cases in a given version of the software:
- Create reproducible scenarios for different use cases of the software.
- Execute and measure all the scenarios.
- Compare the energy consumption of each of them.
This analysis allows you to identify particular parts of the code that require some optimisation.
👉 Note:
I am only referring to energy consumption by use case. Instead of use cases, we could be talking about the energy consumption of methods, classes, and other software units. I find the analysis by use case more interesting because it is easier for developers (or other stakeholders) to have a notion of which use cases are more frequent in a real usage scenario.
For example, if we are analysing the energy consumption of a video player, it is more important to make sure it is energy efficient in the use case of playing a video than in the use case of exporting it to a different format. Thinking by use case allows you to easily communicate your findings with other stakeholders (even non-technical) and helps you prioritise optimisation efforts in a “world” where energy efficiency is not the top priority.
Deciding on a suitable energy profiler
So far, we have covered six energy profilers. Each one of them has advantages and disadvantages. Most of all, they have particular requirements that make them suitable or not to your particular case. Unfortunately, I have not come across a single solution that works for all devices and operative systems. The problem lies mostly in the fact that Intel and AMD computer architectures require a different approach to collect power data.
Use the decision diagram below to help you decide on which energy profiler to use.
the command-line?} D -->|Yes| DY[Intel PowerLog] D -->|No| DN[Power Gadget] C -->|Linux| E{Processor?} CA -->|No| C{OS?} E -->|Intel| F[Powerstat, PowerTOP, Perf, or Likwid] E -->|AMD| PowerTOP CA ---->|Yes
Windows/Linux| Nvidia-smi C -->|Windows| D
Alternative tools not covered here
There are many other energy profilers out there. In this article, we are only covering the minimum set of profilers that you have to learn to be able to measure energy consumption in most software systems. If you are curious and want to give it a try with other tools, here is a list of alternative energy profilers:
- Intel RAPL
- RAPL is internally used by almost every energy profiler for Intel devices out there, including the ones mentioned in this post: PowerLog, Power Gadget, Powerstat, and PowerTop.
- CodeCarbon
- A really nice Python library that collects energy data in Python code. Unfortunately, it only works on Intel devices, as it uses RAPL under the hood.
- Android Runner
- Supports multiple energy profilers and power monitors for Android devices.
- Trepn Profiler
- Energy profiler for Android applications developed by Qualcomm. It has been used by many researchers but it is no longer being maintained.
- MLCO2
- Estimate the carbon footprint of training your machine learning model.
- Website Carbon Calculator
- Measure how green is your website when compared to other websites out there. It provides a rough estimation of the carbon footprint of a webpage based on the data transferred while loading it.
- Syspower
- Lightweight tool to collect real-time power data from your Mac. It reads directly from the System Management Controller in Intel-based Macs.
- Windows Energy Estimation Engine (E3)
- Built-in tool available on Microsoft Windows. Check out the tutorial by Scott Chamberlin.
Wrap-up
In this post, we have covered 6 energy profilers that will help you measure the energy consumption of virtually any desktop/server software. Regardless of whether you are working on an academic project or production-ready software, it is always worthwhile to keep an eye on energy efficiency. There is still a long way to go on developing energy-efficient code, but knowing how to measure energy consumption is the first step.
Keep in mind though that these tools only provide an approximation of the energy consumption. For instance, after a few experiments, you will notice that re-running the same measurement multiple times will give you slightly different results. That is something I might cover in more detail in a future post.
I hope you enjoyed the article. If you have any suggestions of other tools or if you have any questions about energy profilers just ping me over Twitter or by email.
Useful resources 📚
If want to learn more about this topic, here are some follow-up pointers you should not miss:
- Ubuntu docs on Power Management: Identifying Issues.. It provides a list of different tools that will help you debug power management issues on Linux systems.
- Energy Patterns for Android Applications. A catalog of 22 energy patterns. Although these patterns were tuned for Android apps, they might inspire you on energy-efficient solutions for your server/desktop software projects.
- ClimateAction.tech. A great slack-based tech community to meet, discuss, and learn about climate action. Its main focus lies on Business Culture & Behavior Change, Green Software Engineering, Sustainable Product Design, and Low-Carbon Infrastructure. I totally recommend it!
Acknowledgements
Kudos to Clara Gomes and Pooja Rani for the feedback on early revisions of the article. Thanks, Stefanos Georgiou for adding Perf, Nvidia-smi, and Likwid.
Bibtex metadata:@misc{cruz2021tools,
title = {Tools to Measure Software Energy Consumption from your Computer},
author = {Lu\'{i}s Cruz},
year = {2021},
howpublished={\url{http://luiscruz.github.io/2021/07/20/measuring-energy.html}},
doi = {10.6084/m9.figshare.19145549.v1},
note = {Blog post.}
} © 2021 – onwards by Luís Cruz. Licensed under the