Are YouTube’s Default Features Silently Wasting Energy? An Experimental Evaluation
Cosmin Anton, Jan Kuhta, Ada Turgut, Thomas van der Boon.
Group 34.
This study investigates whether YouTube’s optional player features—Ambient Mode, Stable Volume, and Voice Boost—affect client-side energy consumption. In controlled experiments isolating each feature, we measure energy usage relative to a baseline with all features disabled. Our results show that Ambient Mode significantly increases energy consumption, while Stable Volume and Voice Boost do not exhibit a measurable impact under the tested conditions. Since Ambient Mode and Stable Volume are silently enabled by default, these findings suggest they should be reconsidered or turned off to reduce energy use at scale.
Introduction
YouTube is one of the most widely used online video platforms in the world. According to Global Media Insight, the platform attracts approximately 122 million daily active users, collectively watching over 1 billion hours of video each day [1]. This scale of consumption translates into a significant and growing energy footprint, spread across data centers, network infrastructure, and the client devices of viewers worldwide.
In addition to the established YouTube settings, such as video quality, playback speed, and subtitles, YouTube has recently introduced several optional player features to improve user experience: Ambient Mode, Stable Volume, and Voice Boost. However, these features are far less familiar to users than traditional ones. Notably, two of these (Ambient Mode and Stable Volume) are enabled by default, regardless of whether the users are aware of or want these features. Many viewers may therefore be consuming additional computational resources without consciously opting in.
In this blog post, we investigate whether these non-essential YouTube settings have a measurable effect on client-side energy consumption. We conducted a controlled experiment in which each feature was enabled in isolation and energy consumption was recorded over repeated trials. Our hypothesis is that each of these features introduces additional computational work and therefore increases energy consumption relative to the baseline, where all those features are disabled.
If this hypothesis holds, it raises a broader and important question: should non-essential features that increase energy consumption be enabled by default — particularly at the scale of billions of viewing hours per day? Even marginal increases per device could translate into significant aggregate energy costs. In this case, the platform designers should reconsider these defaults in the interest of energy efficiency and sustainability. We approach this research question through a series of replicable experiments outlined in our Methodology. We then further discuss the analysis of our results, their discussion, and last the limitations we had as well as future possible work.
Methodology
Our method of exploring this hypothesis was to first outline the explored settings, then automating the workflow of the EnergiBridge measurements, and lastly analyzing our results.
Explored YouTube settings
YouTube offers several optional settings that can be toggled in the settings menu. Since we wanted to measure each of these features’ additional consumption, we measured each setting in isolation in order to be able to reach more specific conclusions. For this experiment, we isolated three non-essential features, testing each individually against a common baseline.
Ambient Mode extends the video’s color onto the surrounding page background, creating a soft glow effect that mirrors the on-screen content in real time, dynamically adjusting when scenes change [2]. This feature is only active in dark mode and is enabled by default.
Stable Volume automatically normalises audio levels during playback, dynamically adjusting the volume to reduce sudden loudness spikes and flatten the dynamic range within a video [3]. This setting is also enabled by default.
Voice Boost enhances the clarity of speech in videos by using AI to identify vocal frequencies and amplify spoken dialogue relative to background sounds such as music or ambient noise, with all processing occurring in real time on the client side [4]. Unlike the other two settings, Voice Boost is disabled by default, but remains relevant to our experiment as it represents a feature that a significant portion of users may choose to enable.
The baseline condition (all-off) disables all three features simultaneously and serves as our reference point for energy consumption.
Experiment procedure
We defined four conditions (one per setting plus the baseline) and conducted 30 trials per condition, running 120 trials in total. To minimize human error and ensure consistency across trials, the entire experiment was automated using Python and Playwright [2]. The hardware and software details of the machine on which we conducted the experiment are provided below in section Hardware/Software Details. The video used throughout all trials was a fixed, publicly available YouTube video with no ads and streamed at a consistent quality (480p).
Zen Mode
Before the experiment began, we prepared the machine by closing all applications, disabling all notifications, disabling brightness adjusting. Display brightness and system volume were both fixed at 30% for the duration of the experiment, this is discussed further in the Limitations section. Although a wired ethernet connection would have been preferable for network stability, it was not not feasible throughout the timeline of the project, so all trials were conducted over the same Wi-Fi network. We acknowledge this as a potential source of variance in our measurements.
Workflow
With our computer in “zen mode”, we started a 5-minute warm-up phase in which we ran a Fibonacci sequence computation to bring the CPU to a stable temperature and avoid cold-start effects in the early trials. After the warm-up, we executed 120 trials (30 per condition) in a randomly shuffled order to mitigate any temporal correlations between trials.
Between each trial, the system was left idle for 30 seconds to allow it to stabilize before the next measurement began.
Each trial proceeded the workflow as follows:
- Opening Chrome browser in incognito mode with dark mode enabled via a pre-set YouTube cookie.
- Navigating to the chosen YouTube video, accepting the cookies, and temporarily pausing playback.
- Applying the designated YouTube setting for that trial.
- Resuming playback and recording energy consumption using EnergiBridge [5] for 60 seconds of video playback.
- Closing the browser and waiting 30 seconds before the next trial.
Hardware/Software Details
Below we outline the specifications we used to run the experiments for replicability.
- Model Name: MacBook Air
- Model Identifier: Mac14,2
- Chip: Apple M2
- Total Number of Cores: 8 (4 performance and 4 efficiency)
- Memory: 8 GB
- Resolution: 2560x1664 Retina
- Refresh Rate: 60Hz
Data Analysis
For each trial, energy consumption was recorded with EnergiBridge continuously over a 60-second playback window. The primary metric extracted from these measurements was System Power (Watts). To obtain a single representative value per trial, we averaged all recorded timestamps within the interval. This resulted in one aggregate value per trial, which we refer to as Average System Power (Watts) and use as the key metric in our data analysis.
Outlier Removal
Initially, outliers were considered for removal using a Z-score threshold of 3.0. However, this approach proved unreliable and not sufficiently robust for our case, as multiple extreme values inflated the standard deviation, leaving some outliers undetected. To address this, outliers were identified using the Interquartile range (IQR) method:
\[IQR = Q_3 - Q_1\]Observations were considered outliers if they lay outside:
\[[Q_1 - 1.5 \cdot IQR,\; Q_3 + 1.5 \cdot IQR]\]Detected outliers were removed prior to further analysis.
Statistical Analysis
The cleaned data were visualized using boxplots, violin plots, and histograms to inspect distribution and variability. Normality was assessed using the Shapiro–Wilk test. Since the distributions did not consistently satisfy normality assumptions, we used the non-parametric Mann–Whitney U test to evaluate statistical significance. The test evaluates whether the probability that an observation from one group exceeds an observation from the other differs from 0.5:
\[H_0: P(X > Y) = 0.5\]for two independent samples (X) and (Y).
Effect Size Analysis
To quantify the magnitude of differences, we computed:
-
Median Difference \(\Delta_{median} = \text{median}(X) - \text{median}(Y)\)
-
Median-Based Percentage Change \(\%\Delta = \frac{\text{median}(X) - \text{median}(Y)} {\text{median}(Y)} \times 100\)
where (Y) denotes the baseline condition.
-
Percentage of Pairs \(\frac{\#\{(x_i, y_j) \mid x_i > y_j\}}{n_X \cdot n_Y}\)
where (n_X) and (n_Y) are the sample sizes of the two groups.
Together, these measures provided us with a solid foundation for evaluating whether the examined features meaningfully influence client-side energy consumption.
Results
The histogram below shows the Average power consumption measurements (in Watts) for each of the four experimental conditions: All Off, Ambient Mode, Stable Volume, and Voice Boost. Each subplot represents one condition, with the x-axis indicating Average power consumption (Watts) and the y-axis representing frequency.
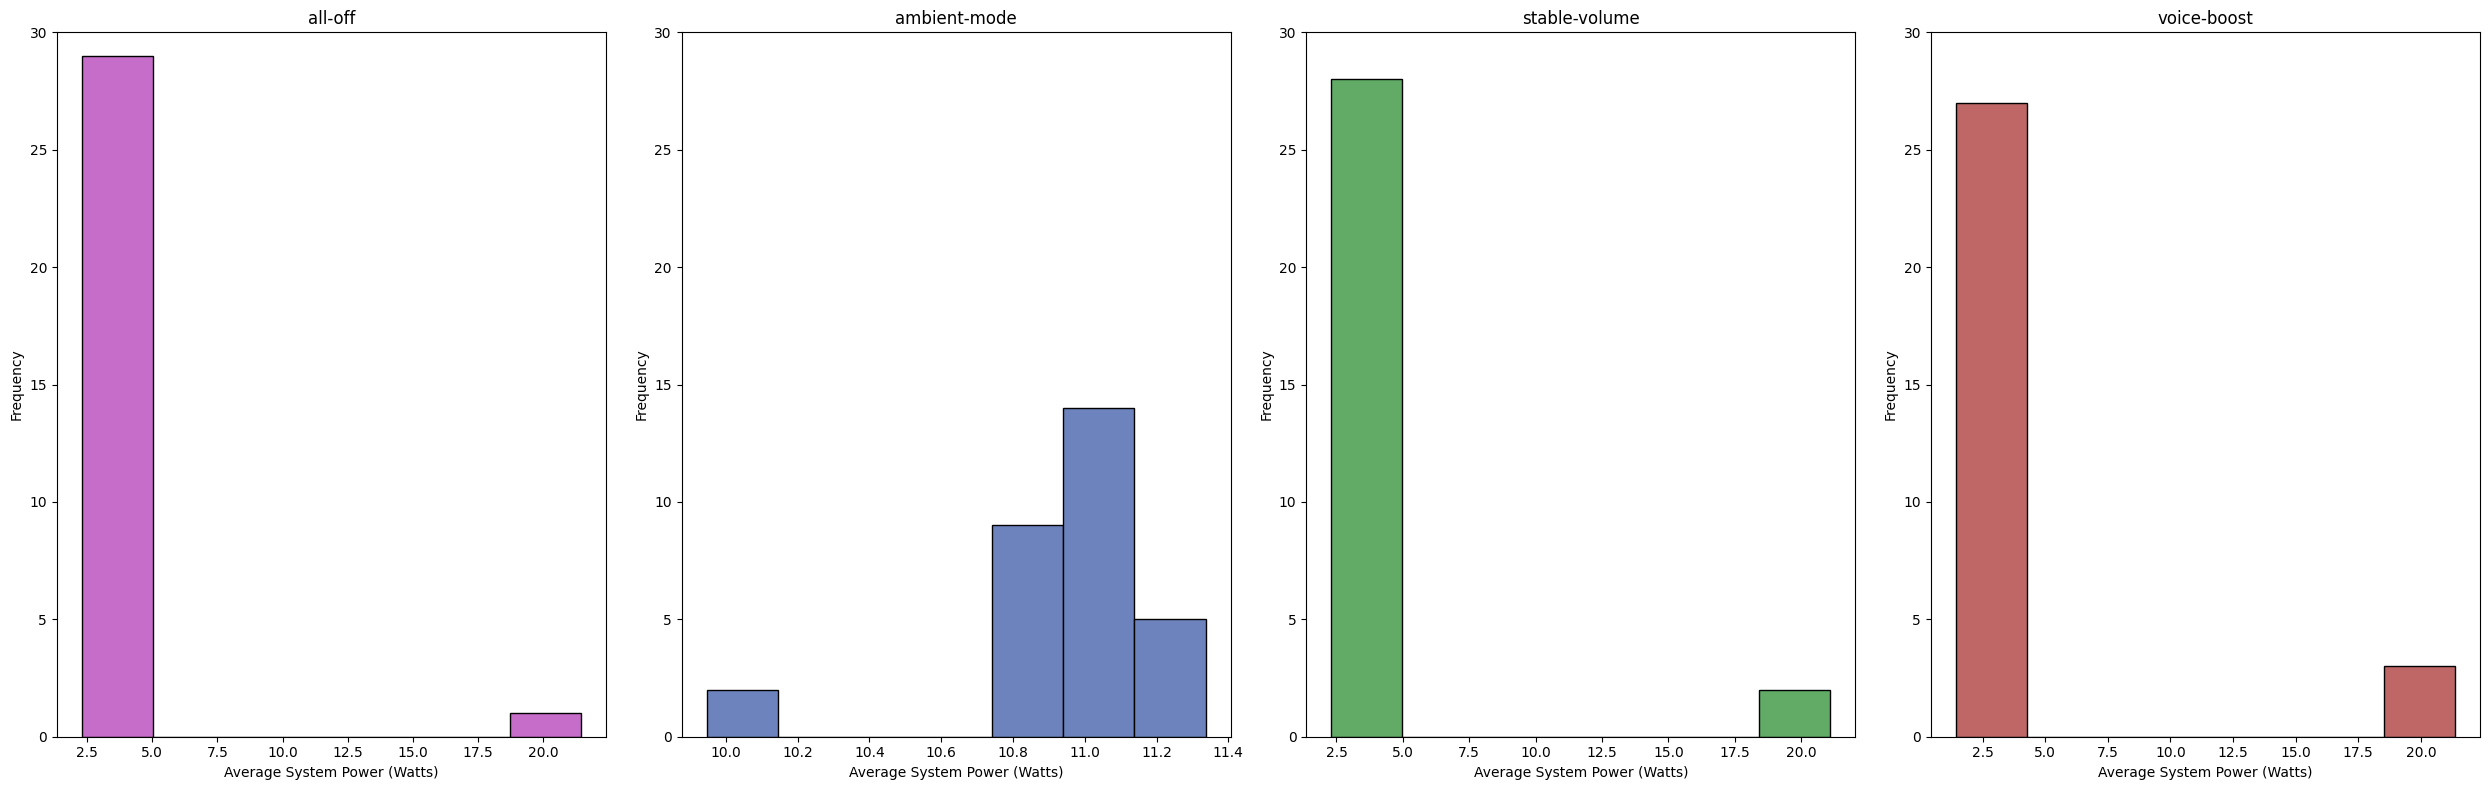
In total, 13 outliers were detected. Most of the detected outliers corresponded to power consumption values of approximately 20 Watts, which is substantially higher than the typical range observed in the experiment. One likely cause is network instability over Wi-Fi. When the network connection fluctuates or bandwidth temporarily drops, YouTube may increase buffering activity to maintain smooth playback.
As explained in the outlier removal section we applied the IQR method to identify and remove outliers. The table below summarizes the number of removed outliers and the resulting valid ranges, which show that the method retained the central mass of the data while removing only extreme deviations, while minimizing information loss.
| Category | Outliers Removed | Valid Range | Total Runs |
|---|---|---|---|
| Stable Volume | 3 | [2.25, 2.47] | 30 |
| Ambient Mode | 2 | [10.56, 11.46] | 30 |
| All off | 1 | [2.18, 2.65] | 30 |
| Voice Boost | 7 | [2.12, 2.40] | 30 |
After removing the detected outliers, we re-examined the cleaned dataset using violin plots.
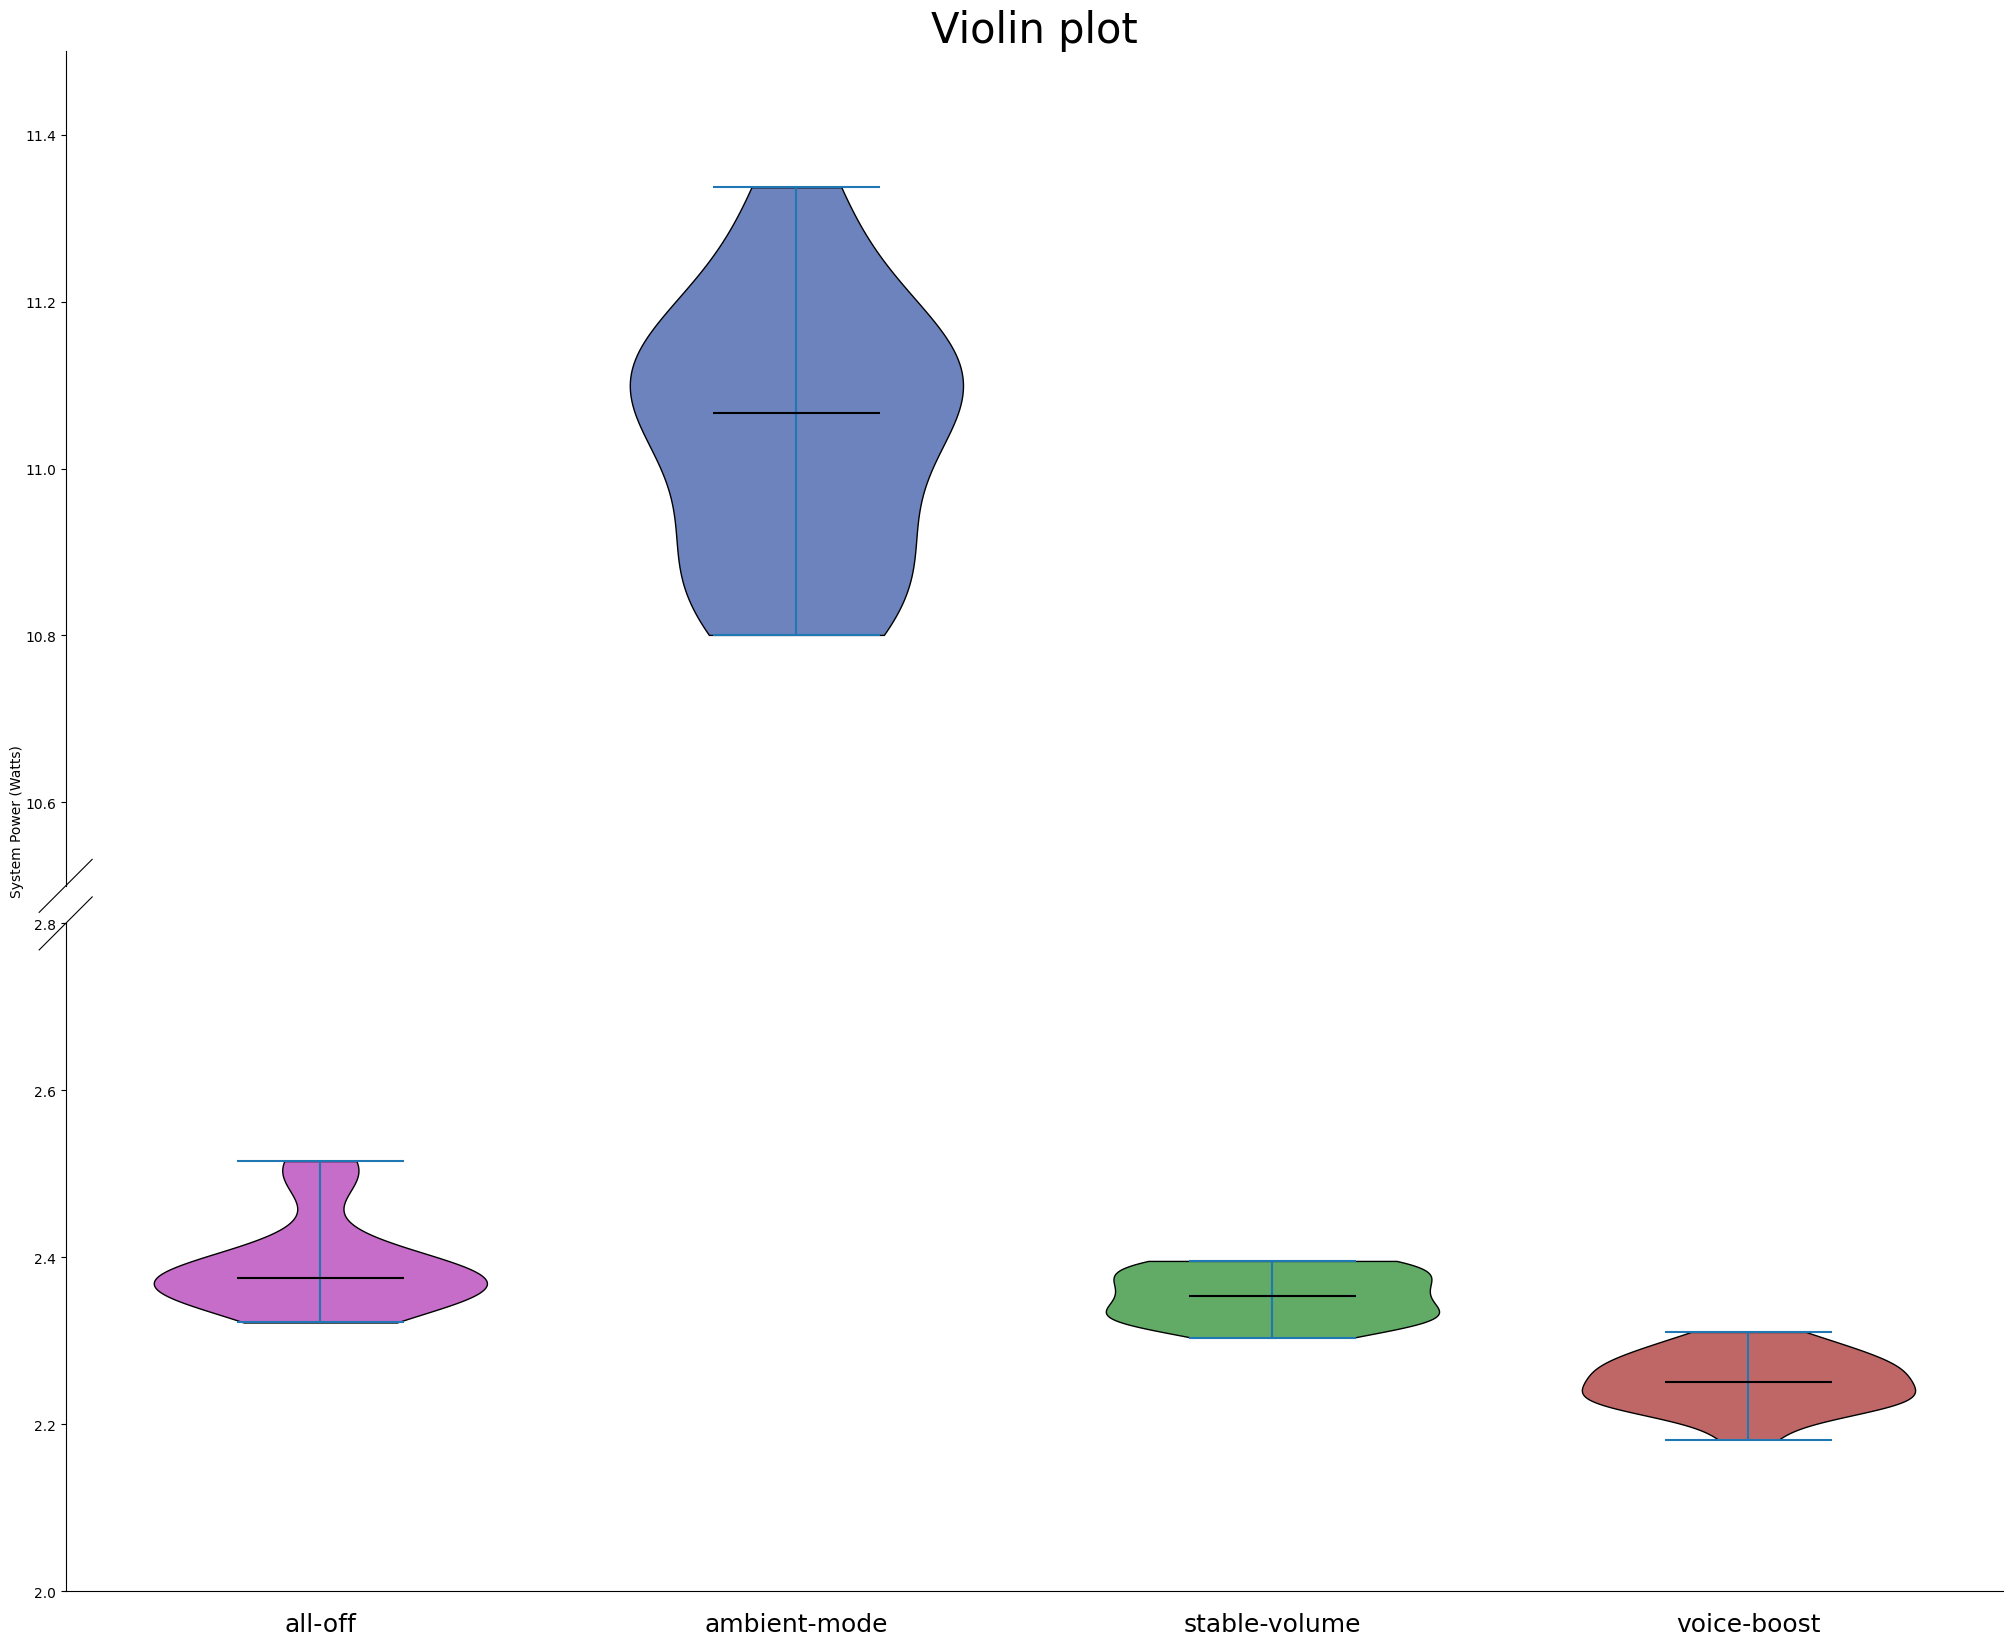
Each violin represents one experimental condition. The vertical axis shows power consumption (Watts), while the width of each violin reflects the density of observations. Ambient Mode clearly stands out, with values concentrated between approximately 10.8 W and 11.3 W, whereas the remaining conditions range between roughly 2.2 W and 2.6 W. Note that the y-axis is visually broken between 2.8 W and 10.6 W to allow all conditions to be displayed in a single figure while preserving their relative ranges. The distributions are relatively compact within their respective valid intervals. Most conditions appear approximately bell-shaped. However, the All Off condition still exhibits a slightly elevated upper tail compared to others.
To further assess distributional properties, we plotted histograms for each condition after outlier removal, where the red curve shows the fitted normal probability density function.
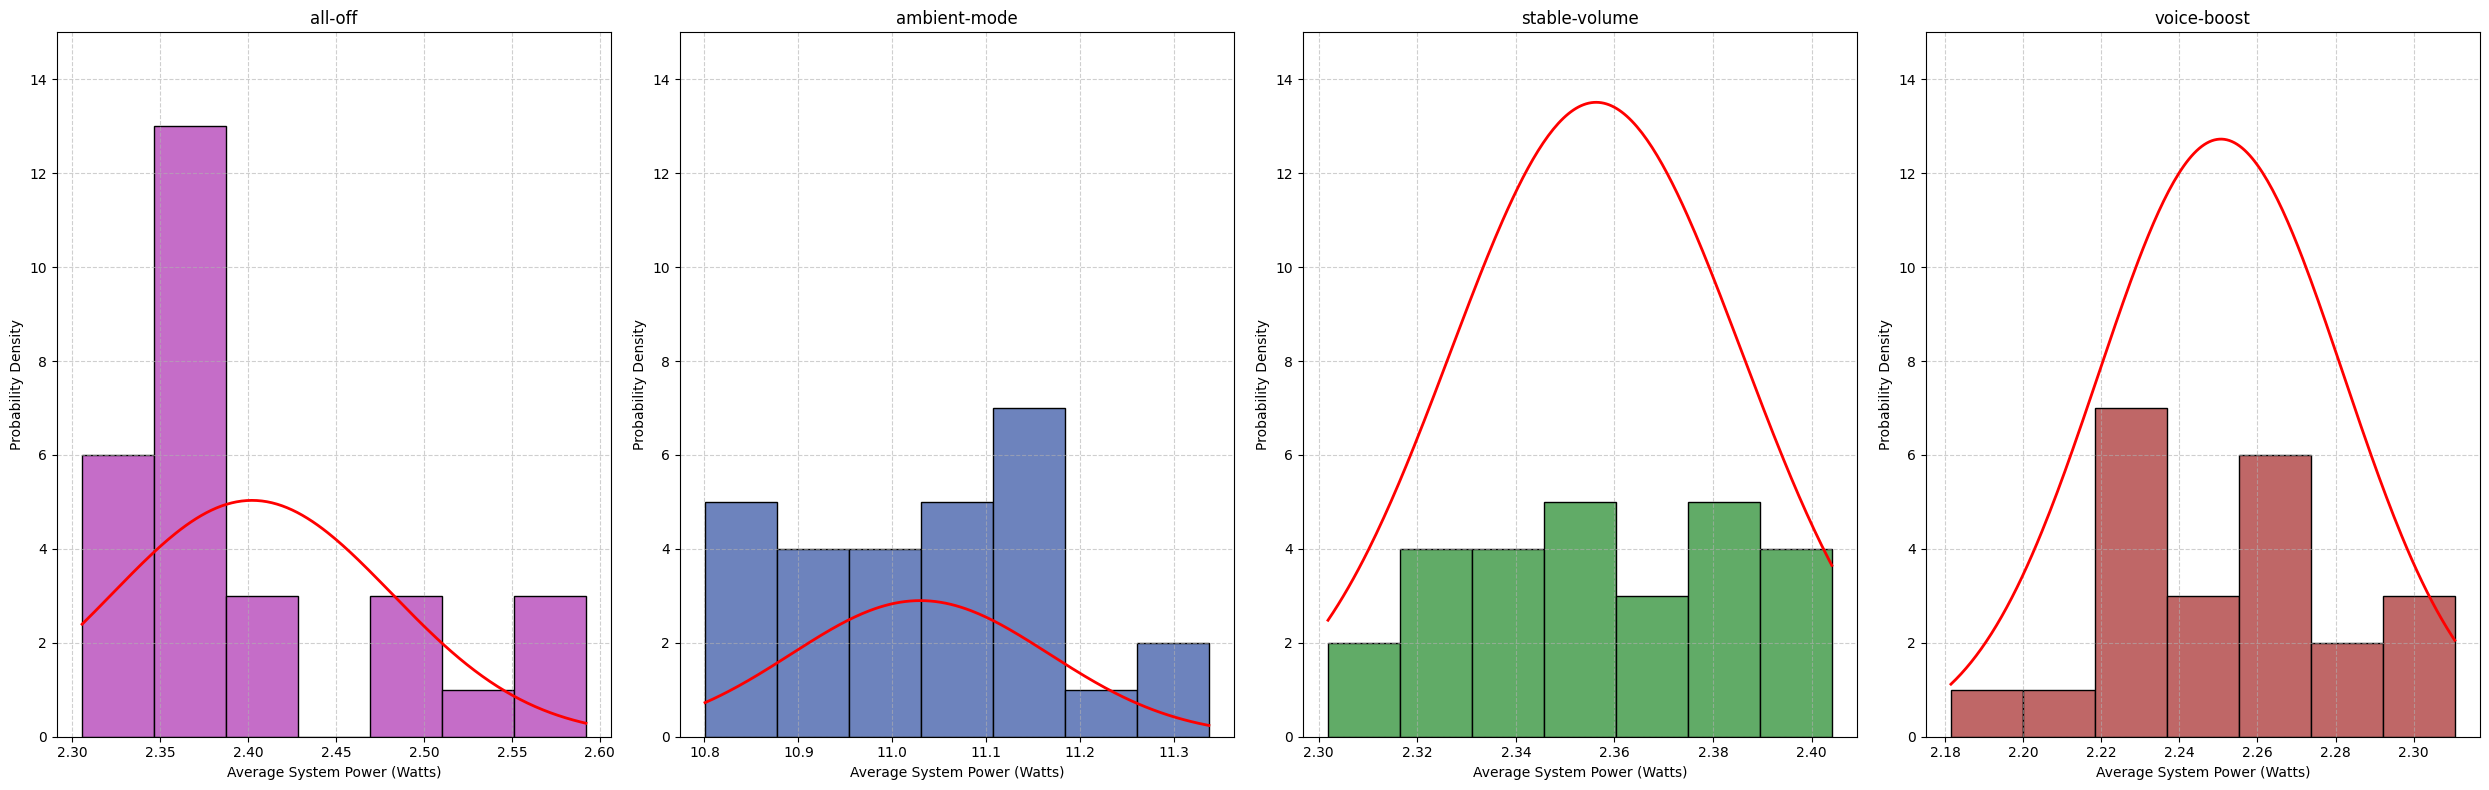
While most conditions visually resemble normal distributions, the All Off condition exhibits a slight right tail, indicating mild deviation from normality. This is somewhat unexpected, as the baseline condition should theoretically consume the least energy. One possible explanation is a relatively small sample size. Potentially also that the computer had to pull more power due to the battery level, as described in Limitations and Future Work. Later in the section Statistical Significance we discuss that although this difference exists, on a statistical level these differences are negligible.
To formally evaluate normality, we conducted the Shapiro–Wilk test for each condition. The results are presented in the table below and confirm our visual observations from the histogram and violin plots.
| Category | p-value | Normality Conclusion |
|---|---|---|
| All Off | 0.00057 | Not Normal |
| Ambient Mode | 0.41224 | Normal |
| Stable Volume | 0.24914 | Normal |
| Voice Boost | 0.68703 | Normal |
Statistical Significance
Because the energy consumption data did not consistently satisfy normality assumptions after outlier removal, we used the Mann–Whitney U test to compare each feature condition against the baseline (all-off). This non-parametric test does not assume normally distributed data and is therefore appropriate for comparing the central tendency of skewed or irregular distributions.
The figure below shows the statistical significance of each comparison, expressed as −log10(p), with the dashed horizontal line indicating the significance threshold of p = 0.05.
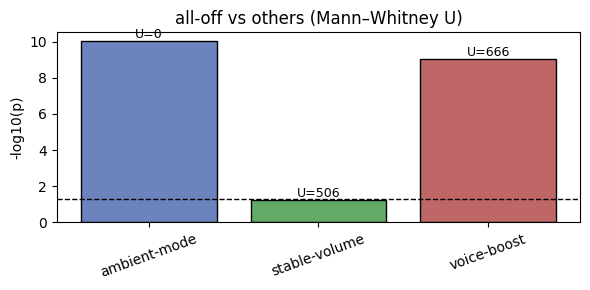
Ambient Mode shows a highly significant difference compared to the baseline (U = 0, p ≪ 0.001), indicating that system power consumption under Ambient Mode is consistently higher than in the all-off condition.
Voice Boost also shows a statistically significant difference relative to the baseline (U = 666, p < 0.001). However, as discussed later in the effect size analysis, this significance does not translate into a practically meaningful decrease in energy consumption.
Stable Volume does not show a statistically significant difference compared to the baseline (U = 506, p ≈ 0.05), suggesting that its effect on system power consumption is negligible under the tested conditions.
Effect Sizes
Statistical significance alone is not sufficient to judge the impact of a feature on energy consumption. To assess whether the observed differences are relevant in practice, we examined effect sizes using three measures: the median difference, the median-based percentage change, and the percentage of pairs.
| Effect Size Metric | Stable Volume | Ambient Mode | Voice Boost |
|---|---|---|---|
| Median Difference (W) | -0.019 | 8.671 | -0.130 |
| Median Percentage Change (%) | -0.782 % | 365.328 % | -5.478 % |
| Percentage of Pairs (%) | 35.38 % | 100.00 % | 0.15 % |
For Ambient Mode, all three metrics indicate a clear and consistent increase in system power usage compared to the baseline. The median power draw increases by 8.67 W, corresponding to a 365% median-based increase, and 100% of Ambient Mode trials consume more power than baseline trials. This pattern indicates a sustained increase in energy consumption rather than an effect driven by a small number of extreme measurements.
In contrast, Voice Boost and Stable Volume show negligible effect sizes. Median differences are close to zero (−0.13 W and −0.02 W, respectively), relative changes are small (−5.48% and −0.78%), and the percentage-of-pairs values remain low (0.15% and 35.38%). This substantial overlap with the baseline distribution suggests that, despite statistical significance for the Voice Boost, the features do not meaningfully affect energy consumption under the tested conditions.
Discussion
From our results, we observed that voice-boost and ambient-mode have a statistically significant difference in their energy consumption compared to the baseline. However, from a practical significance perspective, we observe that for voice-boost the effect size is significantly lower than that of ambient-mode, to the point where it can be considered negligible for a user as it promotes the understandability of a video. In this case, the voice-boost setting is possibly compensating for its marginal energy consumption by reducing the need for additional features that also promote understandability. This can be the use of a higher volume, subtitles, or re-watching that also consume additional energy. Therefore, we only reach conclusions on the ambient-mode setting in this study and discuss the rest further in Limitations and Future Work.
For ambient-mode, we have observed that it does consume significantly more energy compared to the baseline. This is in line with several sources on the internet, such as a post by Henry Van Megen [6]. These sources attempt to warn that it is consuming energy and resulting in extra C02 while both its environmental impact and added benefit to the user going unnoticed. Considering that Ambient Mode is active by default for dark mode users, many of whom may have chosen dark mode for its energy-efficiency benefits, YouTube has a responsibility to address this design choice more carefully when treating its 2.5 billion users [7]. The company should either clearly inform users about the potential energy implications before enabling it by default or disable the feature by default and allow users to make an informed decision themselves. This is especially important because the feature’s existence is not widely known, and its benefits are generally considered negligible [6].
Limitations and Future Work
We faced several limitations due to the short timespan of the project and our hardware. We outline them below.
First of all, as mentioned in the discussion section, we did not see a significant difference in the use of energy consumption for Voice Boost and Stable Volume. A possible reason for this is that these features heavily rely on dynamic voice ranges and background noises in a video [2] [3]. The content that we used was a story-time video that had stable levels of narration and background music throughout the video, possibly not triggering the use of these voice correction features fully. Unfortunately, we did not have the time to re-run our experiment to address this, but the effect of Voice Boost and stable volume can be explored further by replicating the experiment with different kinds of videos in the future.
Secondly, since the settings are concerned with display and sound, the initial version of the experiment included 100% brightness and volume to better observe the effects. However, since the execution of 4 different cases took several hours, the full-battery of the hardware we used did not last enough to finish the experiment. This is why we used 30% for both brightness and sound to be able to finish the full execution. We decided against the charging of the hardware throughout the experiment since we had assumed that connection of an external device would have an uncontrollable effect on the results. However, reflecting on our experiment, the receding battery might have also affected our results negatively throughout the runs. Therefore, the experiment could be replicated with higher levels of brightness and sound while being plugged to a power outlet, while assessing if this would affect the results or not.
Finally, although we used outlier detection procedures, our results still contain samples that disrupt normality. We have mentioned that a possible cause for this could be the unstable wireless internet connection and the resulting buffering of the video. Since the EnergiBridge tool that we used does not distinguish between energy usage of different processes, we did not have a systematic way of addressing this in our analysis. To address this, the experiment can be replicated with a bigger sample size. Furthermore, a tool can be developed to distinguish and measure the energy consumption of different processes to better observe these external effects to support sustainability research in the future.
Replication
Source Code
The link takes you to our github repository. Follow the instructions to fully replicate our experimentation.
Referencess
[1] Global Media Insight. YouTube Users Statistics. https://www.globalmediainsight.com/blog/youtube-users-statistics/#Daily_Active_Users_on_YouTube
[2] Tactiq. What is Ambient Mode on YouTube. https://tactiq.io/learn/what-is-ambient-mode-youtube
[3] Epic Lab. How YouTube’s New Stable Volume Feature Destroys Your Carefully Crafted Audio Mix. https://epic-lab.com/how-youtubes-new-stable-volume-feature-destroys-your-carefully-crafted-audio-mix/
[4] Nymynet. Voice Boost YouTube Explained: When and Why You Should Use It. https://nymynet.com/voice-boost-youtube-explained-when-and-why-you-should-use-it/
[5] T. Durieux. EnergiBridge. GitHub. https://github.com/tdurieux/EnergiBridge/tree/main/src
[6] Change.org. Reduce energy waste — Help turn off YouTube’s power-hungry default ambient mode. https://www.change.org/p/reduce-energy-waste-help-turn-off-youtube-s-power-hungry-default-ambient-mode
[7] Brian Dean. YouTube Stats: How Many People Use YouTube? Backlinko. Last updated Dec. 29, 2025. https://backlinko.com/youtube-users
Back to all projects