Spotfiy energy consumption comparison
Abdul Wahab Aiman, Bińkowska Maja, El Khal Miguel, Marin Alexandru.
Group 31.
Energy consumption comparison of Spotify during music playback across different client settings using EnergiBridge. We aim to determine which Spotify settings influence energy consumption the most and identify potential energy “pain points” during playback. This includes comparing energy consumption across: - different audio quality levels (Automatic, Medium, High, Very High), - Spotify Canvas enabled vs disabled (for selected audio quality levels).
Spotify Energy Consumption based on chosen settings
Introduction
The Information and Communication Technology (ICT) sector, which includes streaming, now accounts for approximately 1.9% of global greenhouse gas emissions, with streaming representing a major share of that footprint [5]. During playback, the app must download data over the network, buffer it to avoid interruptions, decode the audio on the device, and keep the playback process running smoothly. Because streaming is now a common way people consume music, small energy differences per track can become significant when repeated across many users and long listening times.
Prior research on multimedia streaming suggests that energy use is not determined only by how much data is transferred [1]. It also depends on how the stream is delivered and handled in practice, including network communication patterns, buffering behaviour, and the device workload required for decoding and playback. As a result, the total energy cost reflects the full delivery chain, including the device hardware, the network interface, and the application’s playback behaviour.
Why are audio quality and Canvas important?
Spotify’s audio quality setting matters because it changes the bitrate, meaning how much audio data is delivered per second. Spotify states that Normal is about 96 kbit/s, High about 160 kbit/s, and Very High about 320 kbit/s, while Auto adjusts quality based on the current network conditions [2]. Higher bitrates usually require more data for the same listening time, which can increase energy use by keeping the network connection active more often. At the same time, research on multimedia streaming shows that energy use is not only driven by data volume. It is also affected by how the stream is delivered and handled on the device, including buffering behavior, wireless network activity, and the device work needed to decode and play audio.
In addition to audio quality, Spotify’s Canvas feature may affect energy use. Canvas displays short looping visuals during playback. Spotify describes Canvas as a short looping visual that appears instead of static album artwork [3]. Compared to a static image, these animations can increase screen activity and require extra CPU work in the browser, which could raise power usage even if the audio quality remains unchanged.
Aim of this study and hypothesis
This report measures Spotify’s energy consumption during playback across four audio quality settings: Auto (canvas on and off), Medium, High (canvas on and off), and Very High. Measurements are collected using EnergiBridge under a controlled experimental setup [4]. The objective is to isolate how much energy use changes when adjusting the audio quality level and whether Canvas visuals are enabled. We describe the following hypotheses:
H0: Choice of spotify audio and canvas settings have no significant impact on energy consumption.
H1: Choice of spotify audio and canvas settings have significant impact on energy consumption.
The following sections describe the experimental method, the measurement setup, and a replication guide so that the results can be reproduced and compared reliably.
Methodology
The objective of this study is to measure how Spotify’s energy consumption during playback changes when varying two user controller settings are enabled, audio quality and Spotify Canvas. We focus on the client side impact on a single machine, using EnergiBridge to record power related metrics while Spotify plays the same track under controlled conditions.
Experimental Design
The experiment followed a repeated measures design, meaning the same device and the same song were tested many times while changing Spotify settings. Audio quality was tested at four levels: Automatic, Medium, High, and Very High. The Canvas feature was also included, but it was only varied for automatic and high. This created separate conditions for these settings (for example, high with Canvas on and high_nc with Canvas off). Each condition was repeated 30 times to reduce random variation and improve the reliability of the averages. All runs were performed in a shuffled order using a fixed random seed to reduce the risk that time related effects would affect the outcome.
To avoid capturing short power spikes caused by changing settings or starting playback, the experiment was designed so that Spotify was already playing in a stable state before EnergiBridge began recording. As a result each measurement represents state playback energy rather than energy from UI interaction or startup behavior.
Platform choice and measurement Tools
Spotify was evaluated using the Spotify desktop client, not the browser based web player.. EnergiBridge was used to log energy and system metrics for a fixed measurement window and export them to CSV files, allowing repeatable comparisons across conditions. To reduce inconsistency from manual timing, playback and configuration steps were automated. The automation combined PyAutoGUI for interacting with Spotify’s settings UI using reference screenshots and AppleScript commands to control playback actions such as play, pause, seeking, and bringing the application to the foreground. Importantly, the automation was designed so that configuration work happened outside the EnergiBridge recording window.
Step by step data collection procedure
| Phase | Duration | Action |
|---|---|---|
| Configure | ~7s | Open Spotify settings, apply target audio quality and Canvas state, close settings. |
| Prebuffer | ~12s | Seek to 0:00 → play 10 s (warms decoder, fills buffer) → pause → wait 1 s for CPU activity to decay. |
| Stabilise | ~18s | Resume playback and wait for the audio decoder startup spike to fully clear. |
| Measure | ~13s | EnergiBridge samples at ~200 ms intervals while Spotify plays uninterrupted (song position ~28–41 s). |
Zen mode
To improve repeatability, the experiment was performed using “zen mode”. All non essential applications and background processes were closed, and no other active user tasks were performed during the runs. The device battery was set to 100%, and the laptop remained plugged in throughout the experiment to reduce variability from battery discharge behaviour. This setup aimed to minimize external influences and ensure that observed differences were primarily due to the Spotify settings under test rather than unrelated system activity.
Hardware specifications:
- Device model: MacBook Pro
- CPU / RAM: 18GB
- OS Version: macOS
Replication
To make this study reproducible, the full experiment code, automation scripts, and example outputs are available in our course repository. The repository includes the experiment runner (run_experiment.py), the EnergiBridge measurement target (play_session.py), the Spotify automation controller (spotify_controller.py).
For replication, the following conditions should be kept consistent across runs:
- Keep the same machine and macOS version, since power behaviour can vary cross devices and operating systems
- Close all non essential applications and background processes, and avoid interacting with the device during measurements.
- Use the same network type (e.g., Ethernet) and aim for a stable connection, especially because automatic sound quality can change with network conditions.
- Use the same song and keep the playback view consistent. For canvas tests, ensure the Canvas visual is actually visible when enabled.
Additional replication procedure guidance can be found in our repository’s information.md.
Video Guide
A short walkthrough video demonstrating how to run our experiment setup is provided here.
Results
Data Analysis
We analyzed the results for normal distribution using the Shapiro-Wilk test. If normality was violated, we removed extreme outliers using a z-score threshold of ±3 standard deviations and re-tested normality. When both samples satisfied the normality assumption, we used Welch’s two-sided t-test to compare means and computed Cohen’s d as the effect size. If normality could not be assumed, we used the non-parametric Mann–Whitney U test and reported the common language effect size. In addition to statistical significance (p-values), we reported percentage differences and effect sizes to assess practical significance. This procedure ensured that our conclusions were both statistically sound and aligned with best practices for energy measurement experiments.
For empirical performance measurements, such as measuring the energy consumption of Spotify, issues with normality of data distribution can be a common finding. Due to natural variability in system performance, presence of occasional anomalies or spikes and skewed distributions typical of resource utilization metrics. Therefore, the utilization of Mann–Whitney U test for our data can be explainable. Pairwise comparisons of total energy consumption were conducted using the Mann–Whitney U test, as normality assumptions were not satisfied for all groups. Additionally, for improved result analysis we decided to disregard the first 5 recorded seconds due to large spikes despite waiting 18 seconds for stabilization after each setting. This anomaly was consistent for each of our experiments, therefore we decided to trim it off for consistency and aimed to focus the analysis on stable operating conditions and obtain more representative and comparable energy measurements.
Metrics Applied
Each metric (total energy, average power, CPU usage, temperature) was tested across all experimental conditions. We computed total energy consumption by integrating power over time, along with additional metrics such as average power, CPU utilisation, and temperature.
Charts and Result Explanations
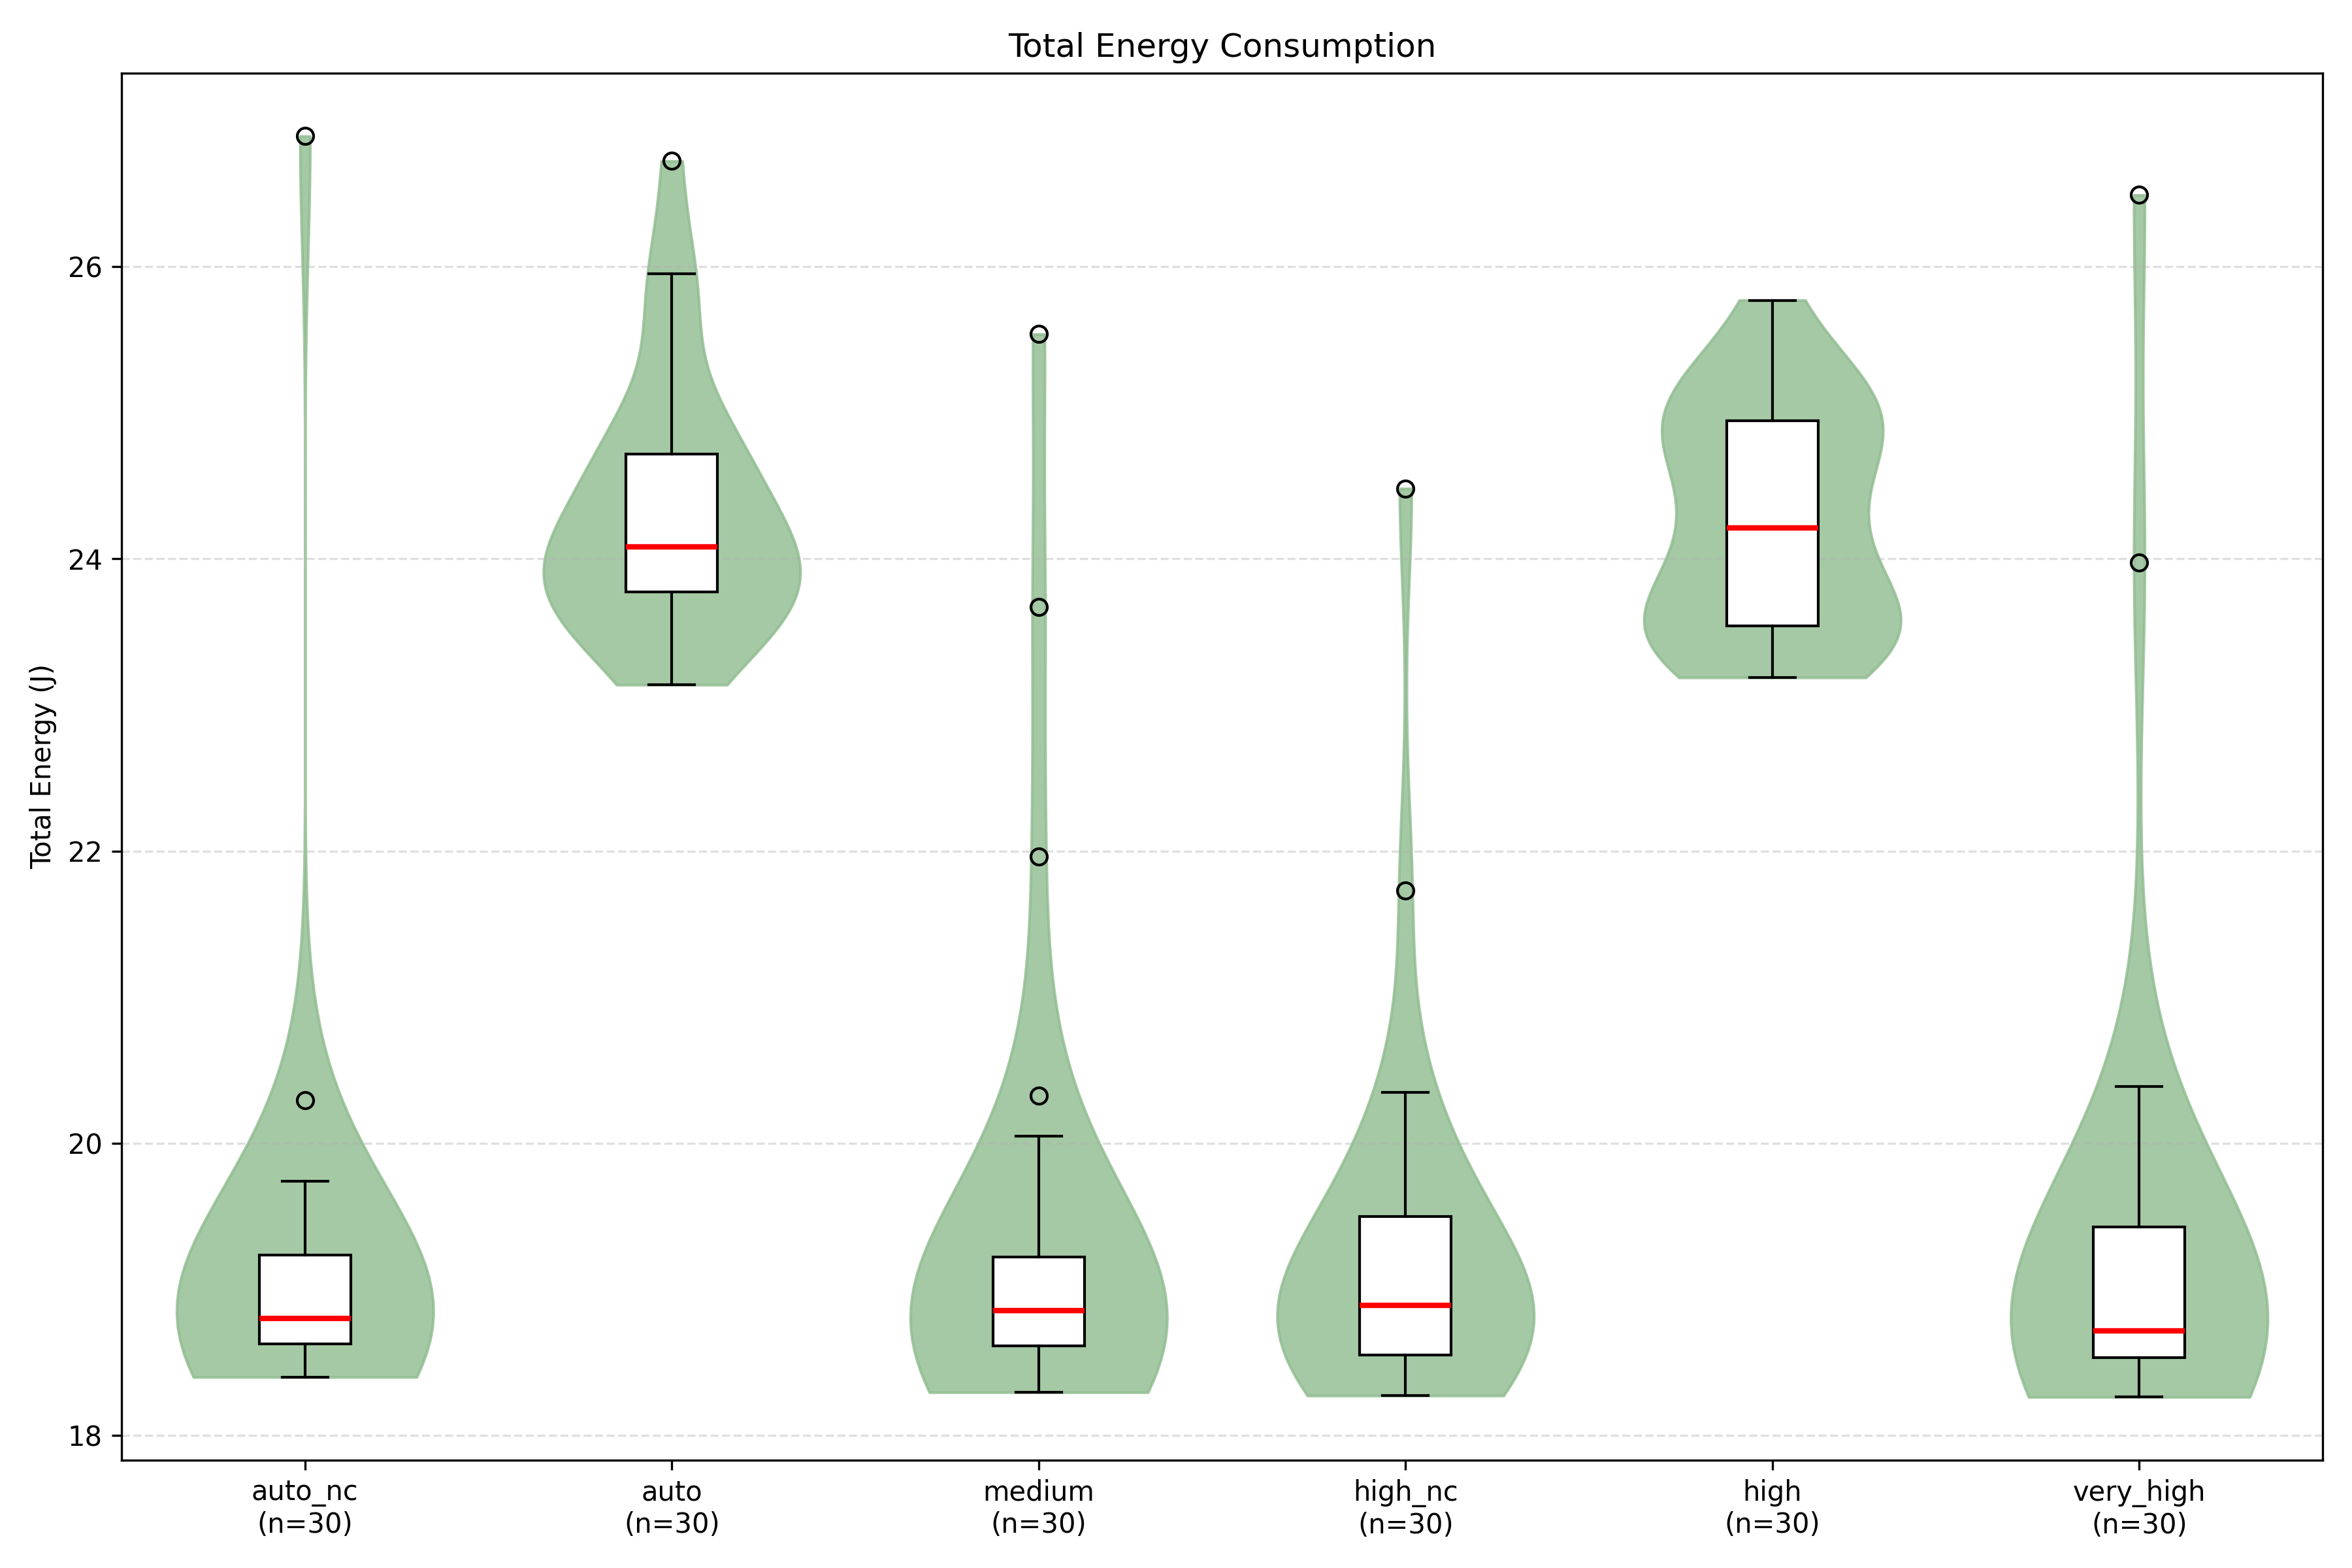
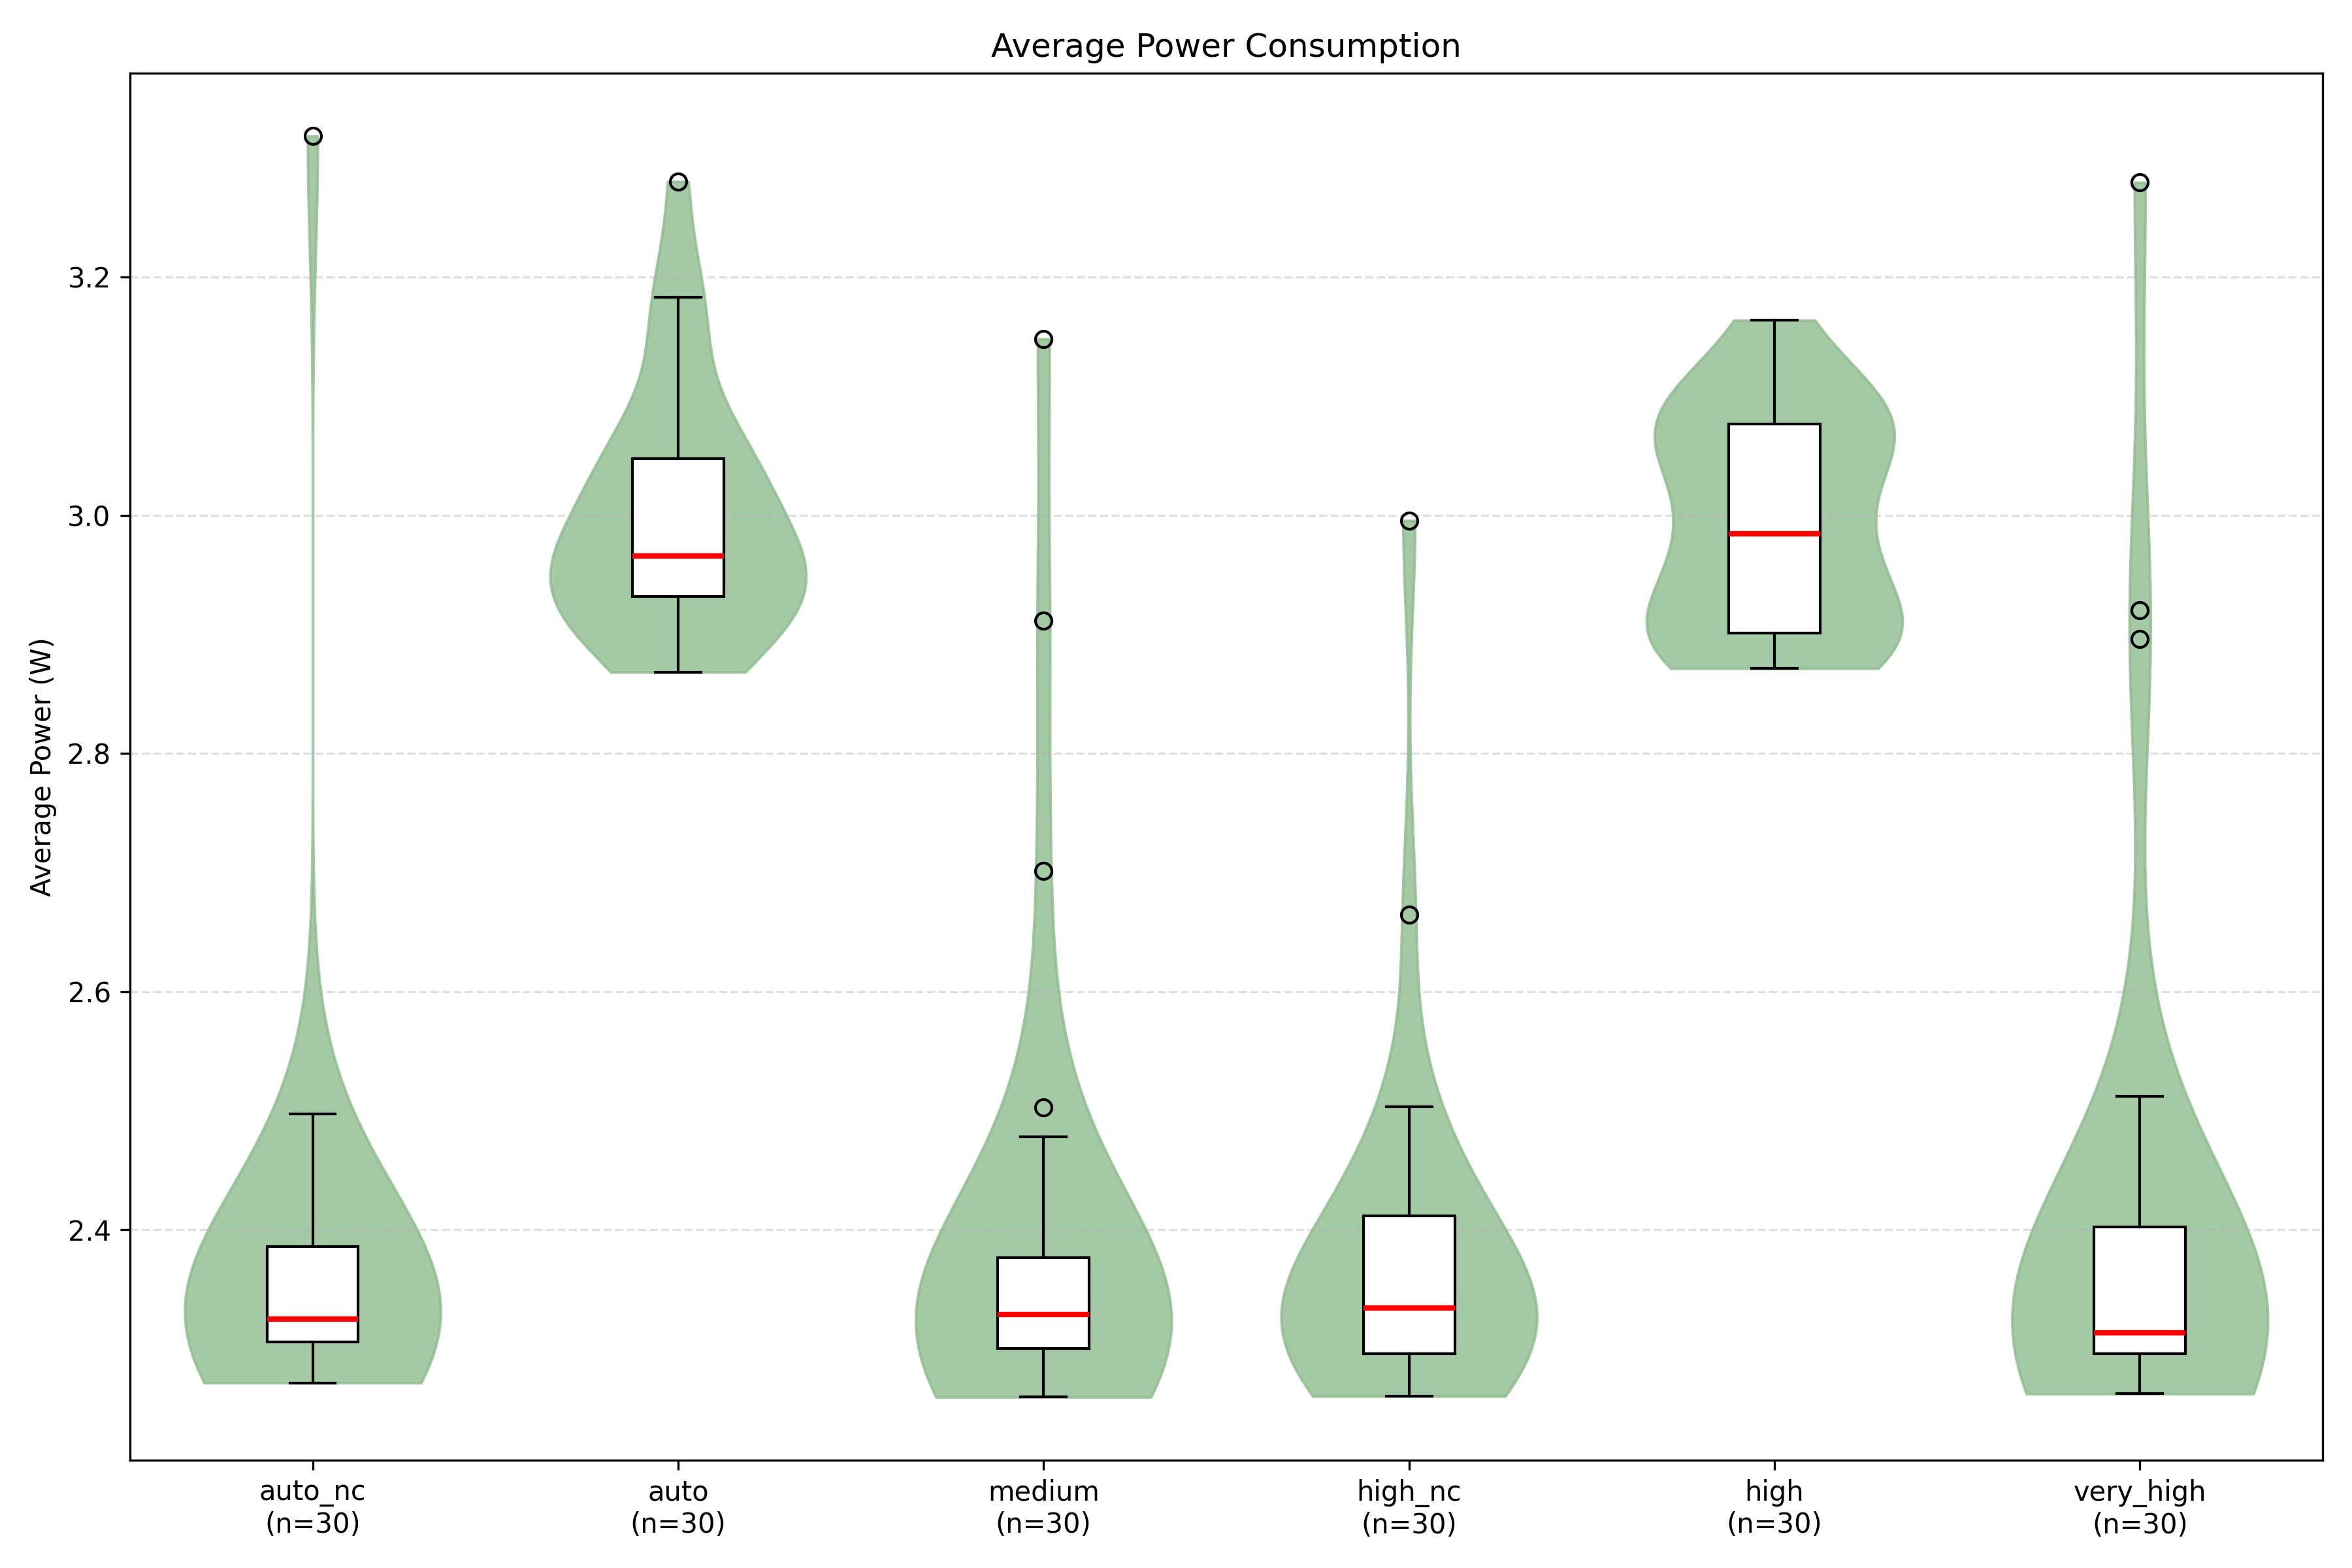
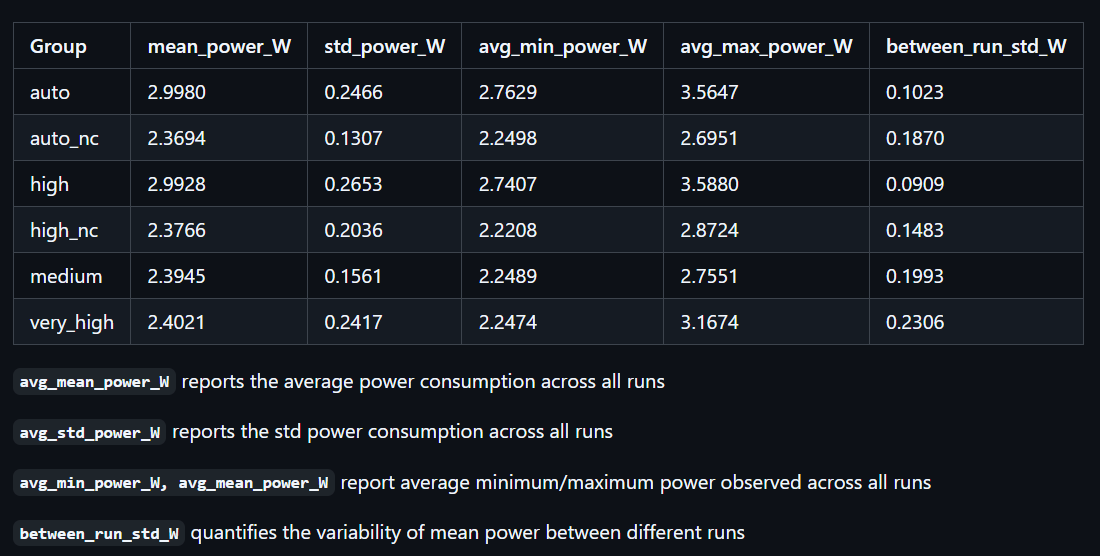
Across 30 repetitions per condition, total energy consumption and average power reveal two clearly separated groups. The auto and high configurations consistently exhibit higher median energy consumption (24–25 J) and average power (3.0 W), while auto_nc, medium, high_nc, and very_high cluster around lower values (18.5–19 J and 2.3 W). Mann–Whitney U tests confirm that comparisons between these two groups are statistically significant (p < 0.001) with very large effect sizes (common language effect size 0 or 1), indicating near-complete separation of distributions. In contrast, comparisons within each cluster show no statistically significant differences (p > 0.5) and negligible percentage differences (0–1%), suggesting that these configurations behave similarly in terms of energy consumption.
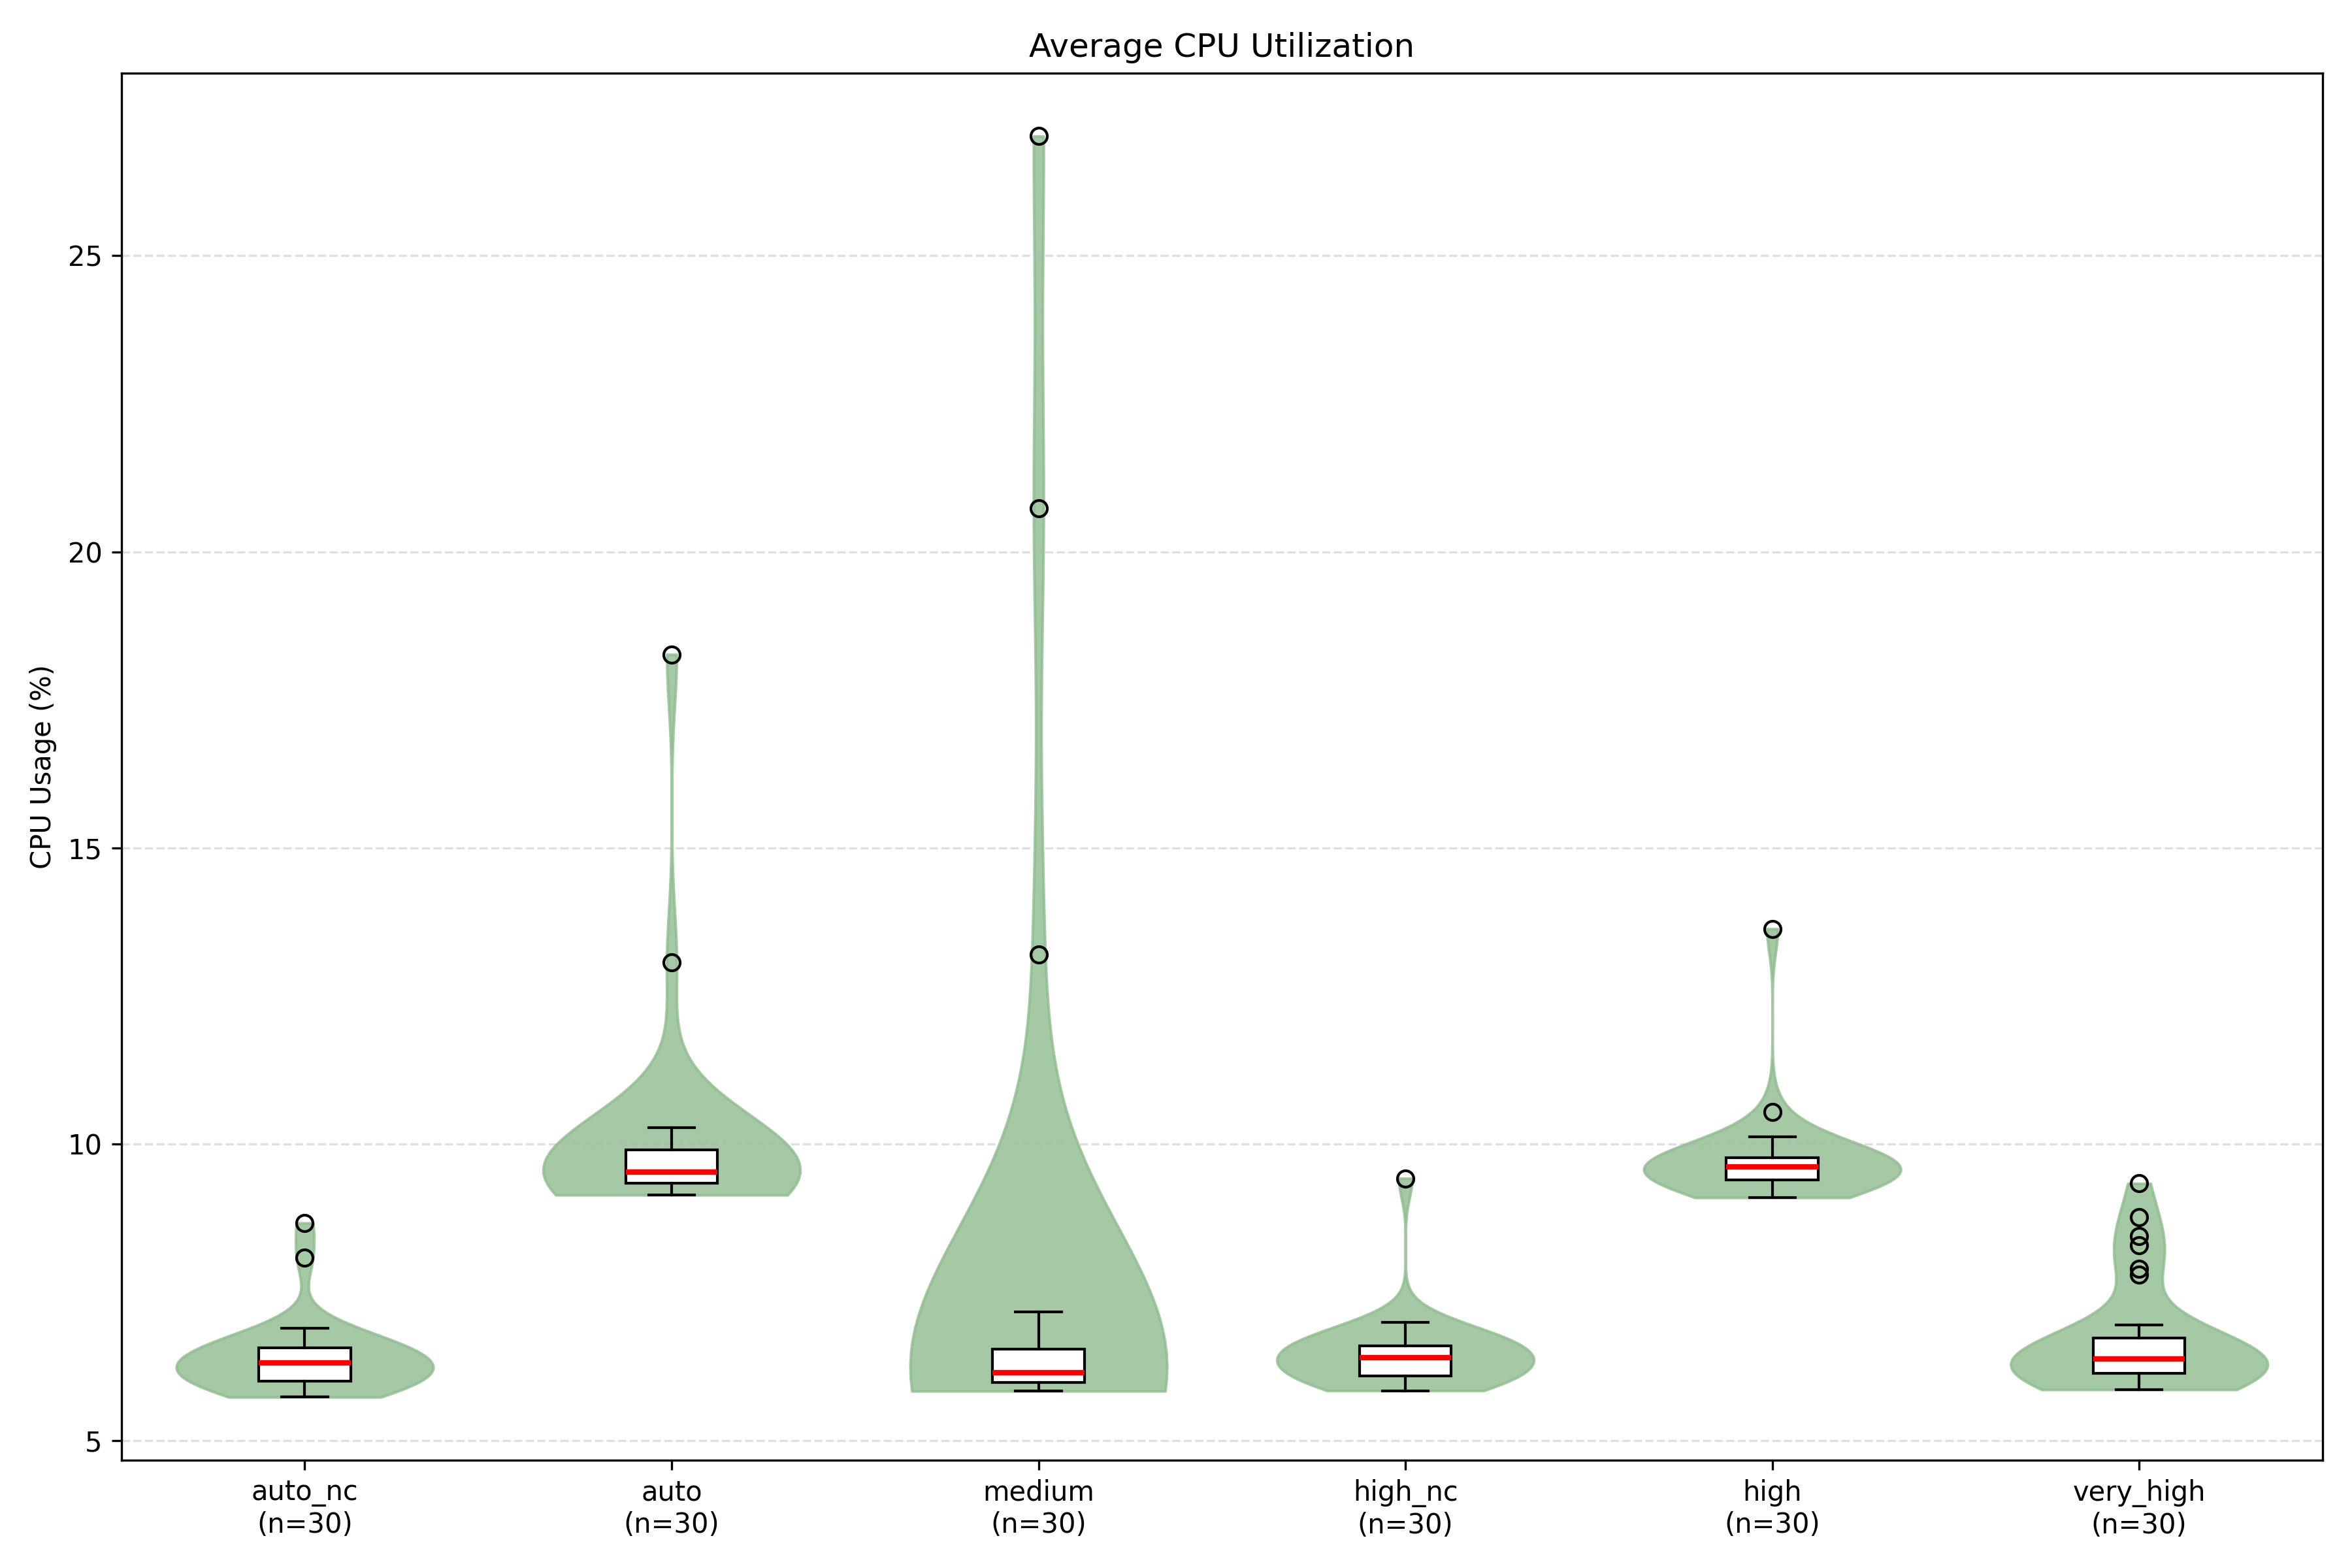
CPU utilisation mirrors the energy pattern: auto and high show higher sustained usage (9–10%), while the remaining conditions remain around 6–6.5%.
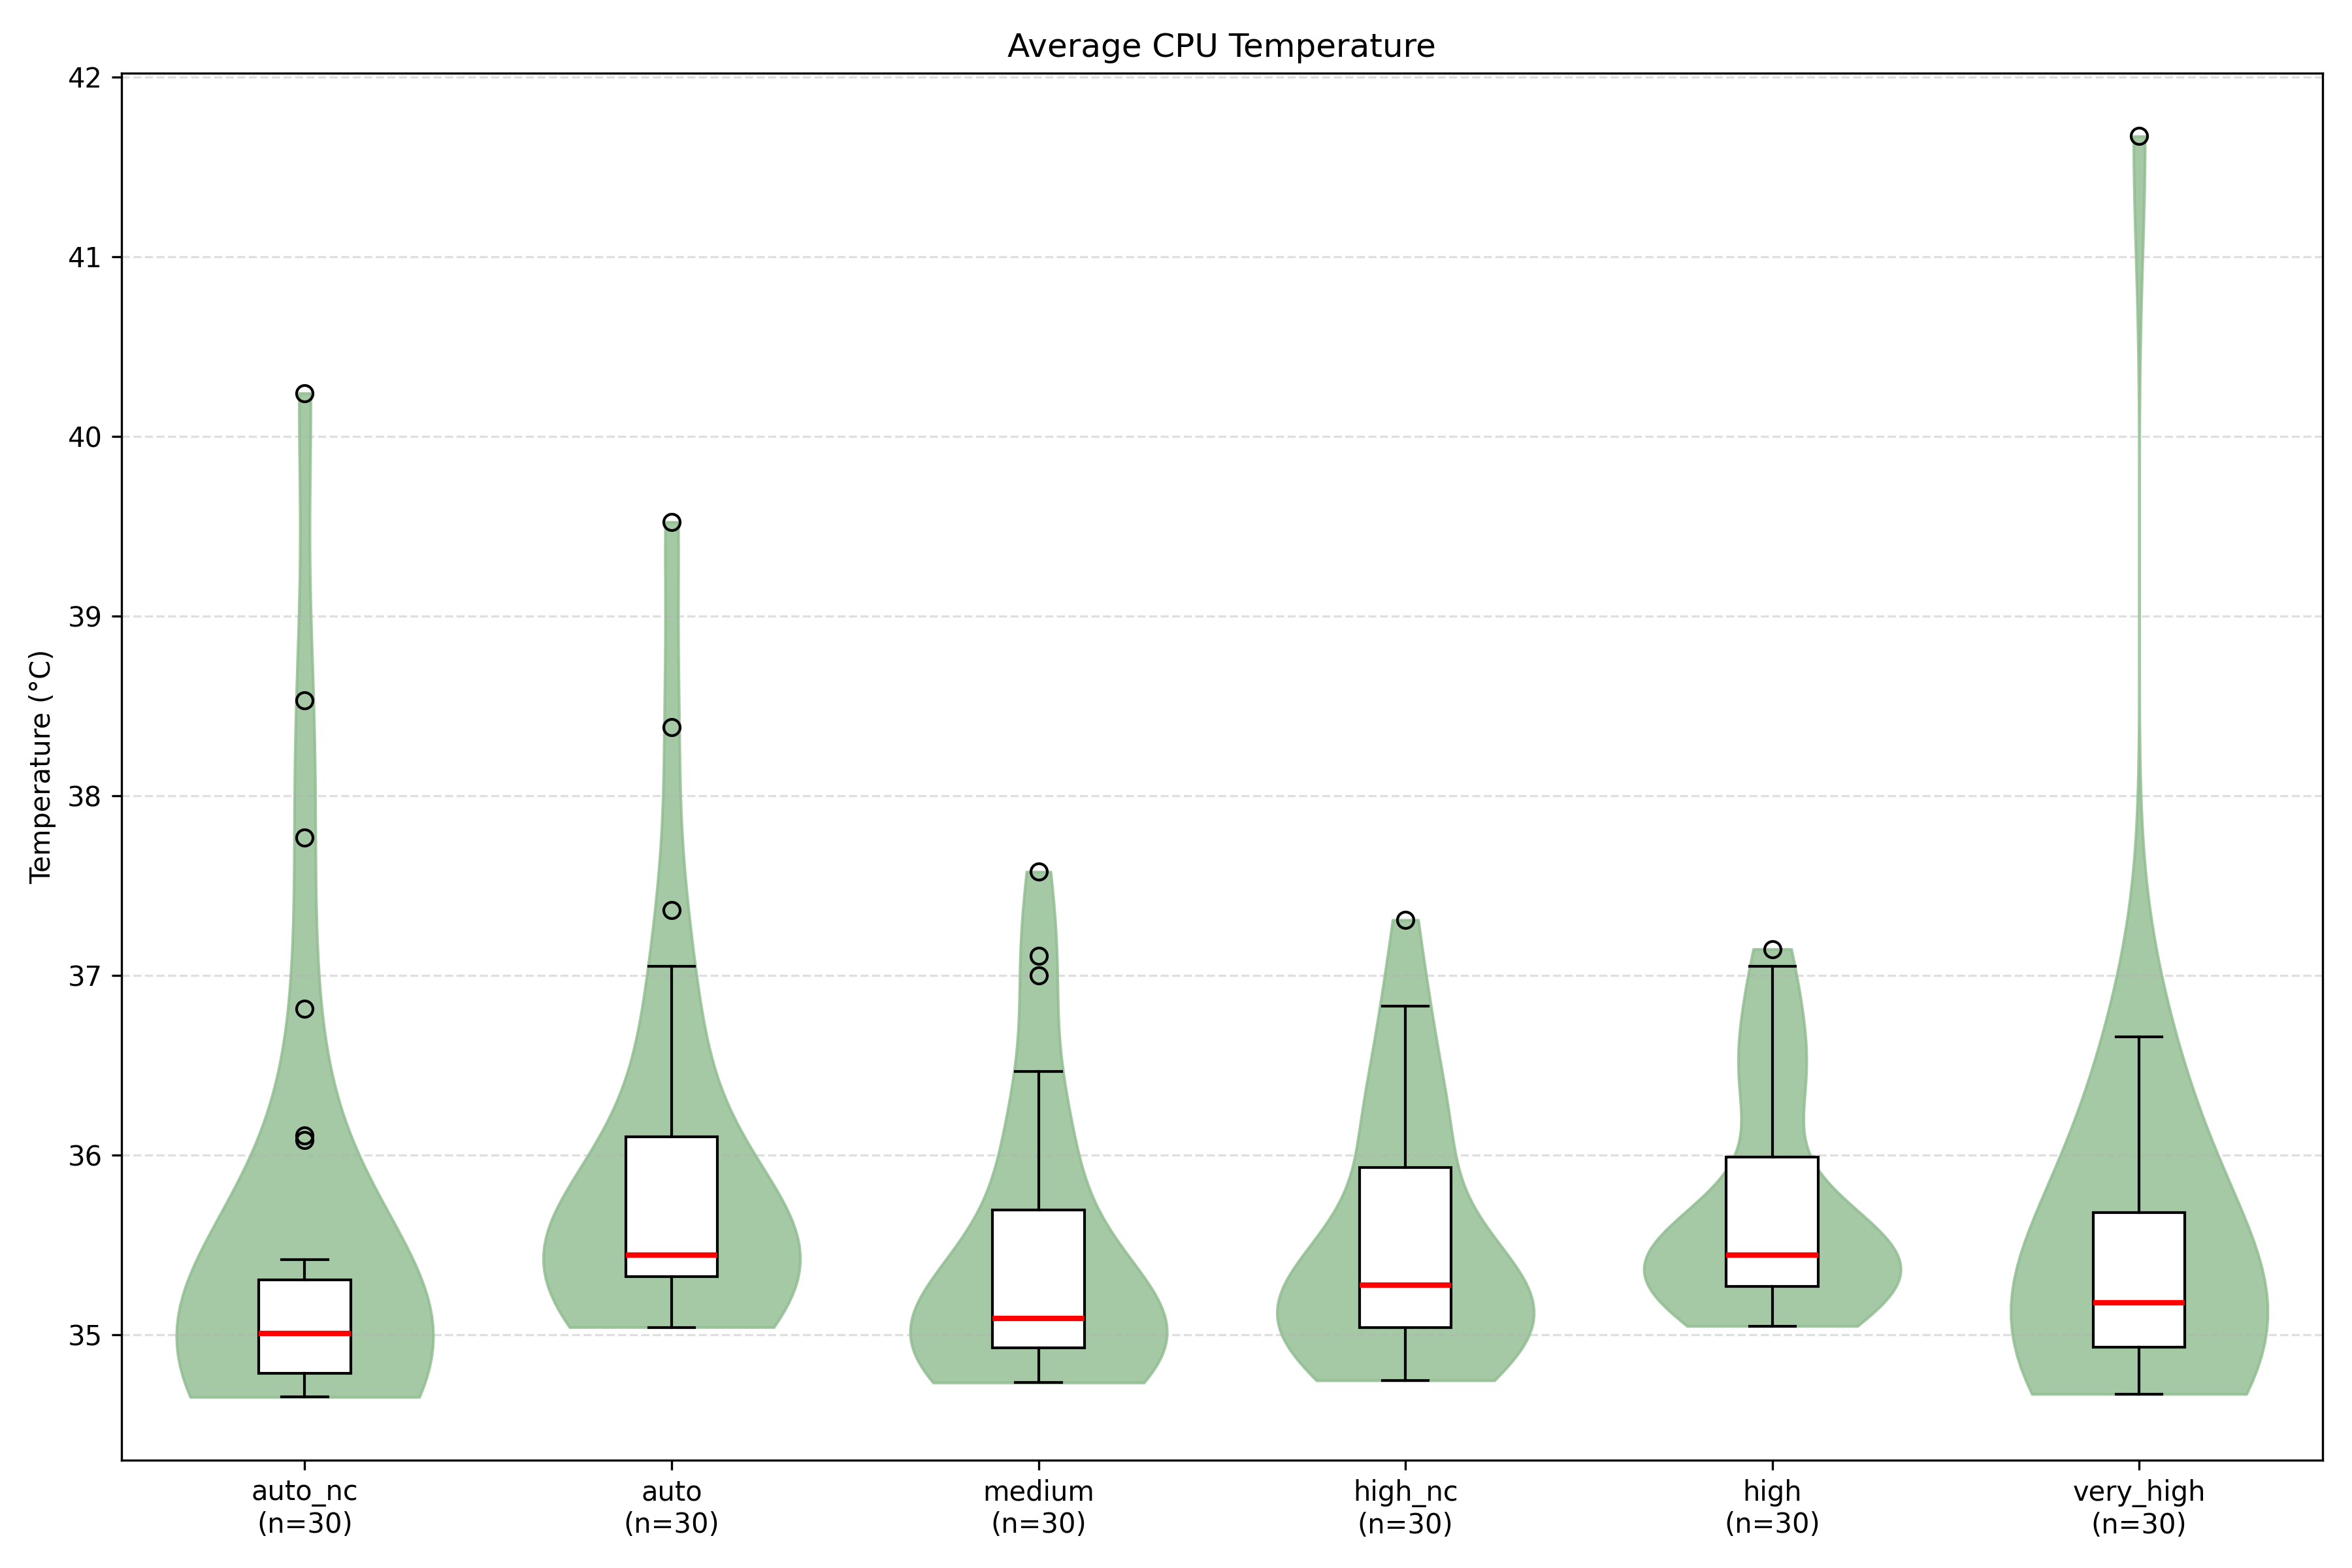
Temperature differences are comparatively small (within ~0.5°C across groups), indicating that thermal variation is unlikely to be the primary driver of the energy gap. The very high setting has the highest outlier.
Discussion
Analysis of the findings shows that configurations with Canva enabled (auto and high) result in higher total energy consumption and average power compared to non-Canva settings (auto_nc and high_nc). Consequently, a user could disable Canva streaming and instead select a higher or very high audio quality setting while still reducing overall energy consumption.
The results suggest that the presence of Canva streaming is the dominant factor in energy consumption, compared to audio effects alone. This provides strong support for the hypothesis H1, indicating that the user interface features and streaming options can significantly influence the power usage. In this case, the null hypothesis (H0) can be rejected.
For users who prioritize high-quality playback while minimizing energy consumption, our results suggest that selecting very high audio quality with Canva disabled is more efficient than the default settings. This emphasizes that interface features, often overlooked, can have a larger impact on device energy demand than content quality itself, offering actionable insights for both consumers and developers seeking to reduce power usage.
Although the results provide a clear impact of Canva streaming and audio quality, the evaluation is done based on a single song and a selected range of settings. More extensive testing should be performed to determine whether the results we obtained can be consistent for different songs and more diverse settings. For future improvements, we could try performing the experiment for full song durations and all settings with Canva enabled and disabled.
Limitations
While this experiment provides a controlled comparison of Spotify playback energy across audio quality settings and Canvas states, several limitations should be considered.
Single device and single operating system
This study was conducted on a single MacBook Pro running macOS, so the results may not generalize to other hardware or operating systems. Power management differs across devices and platforms, and repeating the experiment on Windows and Linux machines, or on additional laptop models, would improve validity.
Short measurement windows
Each run recorded a short window of stable playback. This makes comparisons consistent, but may not represent real listening sessions where thermal behaviour, caching, and dynamic streaming decisions can change over time. Longer measurement periods, such as several minutes per condition would help verify the observed patterns longterm.
Limited song variety
The experiment used a single song ( Counting stars - OneRepublic ), which limits how broadly the results apply. Different tracks may lead to different buffering and decoding behaviour. Testing multiple songs and track lengths would diversify the results
Canvas evaluated only for Auto and High
Canvas was only compared as ON and OFF for the Automatic and High quality settings due to time constraints. Running Canvas across all quality levels would allow for a stronger analysis of the interaction between visual playback features and audio bitrate.
Background variability
While the experiment was performed in a controlled zen mode, some background processes and environmental factors (such as network variability) cannot be fully removed. Increasing repetition further and adding longer cool-down periods could help reduce any noise in our measurements.
Conclusion
This study aimed to investigate whether Spotify’s audio quality and Canva streaming settings significantly impact energy consumption during music playback. Through repeated measurements and statistical analysis, we compared multiple configuration combinations to determine their relative energy efficiency. The results show that enabling Canva has a clear and statistically significant impact on total energy consumption, while differences between audio quality levels alone do not produce meaningful changes. Disabling Canva results in substantial energy savings, even when higher or very high audio quality settings are selected. Therefore, while audio quality selection has minimal influence on energy consumption, the Canva feature significantly increases it.
We can conclude that users seeking to reduce the energy impact of music streaming should prioritise disabling Canva rather than lowering audio quality even for high and very high settings. Visual streaming features contribute more to energy consumption than audio bitrate, making them the primary lever for reducing the environmental footprint of music streaming.
Citations
[1] Hoque, M. A., Siekkinen, M., & Nurminen, J. K. (2013). Energy efficient multimedia streaming to mobile devices — A survey. IEEE Communications Surveys & Tutorials, 16(1), 579–597. https://doi.org/10.1109/SURV.2013.070813.00273
[2] Spotify. (2024). Audio quality. Spotify Support. https://support.spotify.com/ge/article/audio-quality/
[3] Spotify for Artists. (2024). Canvas. https://artists.spotify.com/canvas
[4] Sallou, J., Cruz, L., & Durieux, T. (2023). EnergiBridge: Empowering software sustainability through cross-platform energy measurement. arXiv preprint arXiv:2312.13897. https://arxiv.org/abs/2312.13897
[5]Greenly. (2023). The carbon cost of streaming. Greenly Earth. https://greenly.earth/en-gb/leaf-media/data-stories/the-carbon-cost-of-streaming