Measuring the Energy Cost of Prompt Engineering for Software Engineering Tasks
Roham Koohestani, Zofia Rogacka-Trojak, Antonio-Florin Lupu, Pranav Pisupati.
Group 2.
Prompt engineering often improves answer quality, but it can also increase token usage, latency, and the number of model calls. This project proposes a reproducible experiment design to quantify the energy/performance trade-offs of common prompting strategies (e.g., step-by-step, politeness, and answer-only) on software engineering tasks using automated evaluation.
1. Motivation
Prompt engineering is widely used to improve LLM output quality. Techniques like asking for step-by-step explanations or politely asking for an answer are common practices among users. However, these patternssiginificantly change the number of tokens processed (both input and output), the end-to-end latency, and ultimately, the energy consumption of the inference process.
In software engineering (SE) workflows, where the use of LLM is a daily practice, prompting patterns are no longer just a user-interface choice. They can influence the sustainability of day-to-day engineering work at scale.
This post sets up the basis of an experimental methodology to measure the energy cost of prompt engineering for SE tasks, while keeping the experiment reproducible and statistically defensible.
Inspiration (Related Work)
The idea of performing an experiment on the energy cost of prompting strategies was inspired by the following works:
- Words to Watts: How Prompting Patterns Shape AI’s Environmental Impact
- Green Prompt Engineering: Investigating the Energy Impact of Prompt Design in Software Engineering
- Prompt engineering and its implications on the energy consumption of Large Language Models
Replication Package
A replication package for this study is available on GitHub
2. Research Questions
Through this experiment we aim answer the question of How do common prompting strategies change the total energy consumed per solved SE task compared to a minimal baseline prompt? Moreover, we are exploring whether those differences yield enough quality improvements to justify the energy cost.
3. Experimental Design
To ensure reproducible and reliable results we created a controlled experiment with the following components:
3.1 Prompting Strategies - Independent Variable
We treated the prompting strategy as the independent variable. We kept the model (deepseek-ai/deepseek-coder-1.3b-instruct), decoding parameters (temperature, max tokens), and evaluation harness strictly constant.
Each strategy corresponds to a specific way of framing the prompt, which can influence the model’s response and the number of tokens generated.
baseline_single_shot- A concise instruction with no extra framing.polite_single_shot: The baseline prompt with added politeness markers (“please”, “thank you”) that do not alter the core instruction.think_step_by_step: Requests explicit step-by-step reasoning before outputting the final answer (designed to massively increase completion tokens).answer_only_no_expl: Explicitly requests a short final answer with no explanation (designed to minimize completion tokens).
Note: We avoid relying on hidden “chain-of-thought”. For transparency and comparability, a condition is defined by observable prompt text and an observable output format requirement.
3.1.1 Prompt Templates
All conditions share the same core task payload (the HumanEval function signature and docstring) and only differ in the wrapper text.
We will use placeholders:
{TASK}: the task instructions + condition appropriate prompt wrapper{OUTPUT_SCHEMA}: strict output requirement: Provide your answer in the following format:\npython\n<your code here>\n
baseline_single_shot
{TASK}
{OUTPUT_SCHEMA}
polite_single_shot
Please help with writing the following function.
{TASK}
{OUTPUT_SCHEMA}
Thanks!
think_step_by_step
{TASK}
Think step-by-step. First, write your reasoning. Then provide your final output in a python code block.
{OUTPUT_SCHEMA}
answer_only_no_expl
Do not provide explanations, complete the following function
{TASK}
{OUTPUT_SCHEMA}
3.2 Dataset and Collected Metrics
We utilized the HumanEval dataset, a standard benchmark for evaluating the functional correctness of code generated by LLMs. This allowed us to automatically verify if the generated code actually passed the required unit tests.
For hardware and energy measurement, we used EnergiBridge to log CPU and GPU power consumption. During execution, we logged:
- Timestamps for the start/end of inference.
- GPU and CPU power in milliwatts/Joules.
tokens_inandtokens_outusing the HuggingFaceAutoTokenizer.
3.3 Measurement Hygiene - Protocol to Reduce Bias
We follow common energy-measurement hygiene to reduce confounding, caused by factors such as background processes:
- “Zen Mode” Execution: This was our most critical operational rule. Before any benchmark started, the host machine was put into a strict “Zen mode.” All background applications were closed, system notifications, WiFi, and Bluetooth were disabled.
- Freeze Settings: We fixed screen brightness, power mode, network type, and CPU/GPU power settings to ensure consistency across runs.
- Warm-up Runs: Before recording measurements, we performed warm-up runs to stabilize the model and the system.
- Randomization: We randomized the order of tasks and conditions to mitigate time-based drift in measurements.
- Repetitions: Each (task, condition) pair was executed multiple times to account for variability and ensure statistical significance.
- Output Schemas: We enforced strict output formats to reduce variance in verbosity, which can affect token counts and energy consumption.
3.4 Code for Reproducibility
If you would like to repeat our experiment you can clone our repository from here
4. Exploratory Data Analysis (EDA) and Results
4.1 Overall Energy Consumption
Firstly, we analyzed the average energy consumed per strategy across all tasks. As shown in Figure 1, the think_step_by_step
strategy consumed significantly more energy on average compared to the answer_only_no_expl strategy, which had the
lowest energy consumption. The polite_single_shot strategy showed a slight increase in energy consumption compared to
the baseline_single_shot. Nevertheless, the difference between the think_step_by_step and the other strategy was
the most pronounced, which prompts us to further investigate the underlying causes.
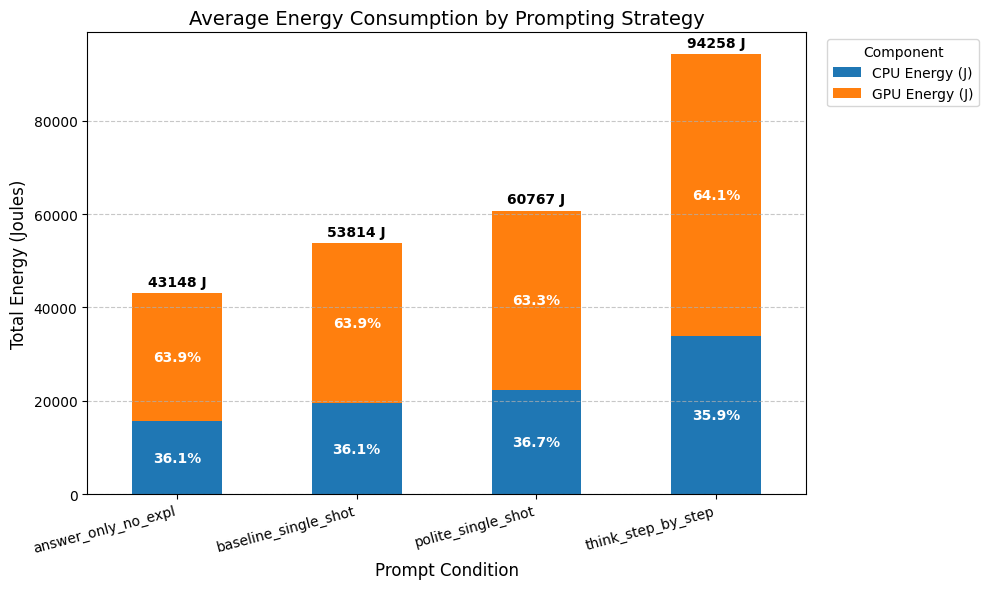
Figure 1: Average Energy Consumed by Prompting Strategy.
4.2 Power Draw Over Time
To understand the cause of those differences, we analyzed the power draw over time for both CPU and GPU. As shown in
Figures 2a and 2b, the think_step_by_step strategy exhibited a significantly longer duration of task execution, than the
rest of the prompts. Which is completely expected given the nature of different prompts. think-step-by-step as well as
polite-single-shot is designed to respond with more tokens, which leads to longer response times and higher energy
consumption. On the other hand, answer-only-no-expl is designed to minimize the number of tokens generated, which
results in shorter response times and lower energy consumption. Thus, it explains the differences in energy consumption observed in Figure 1.
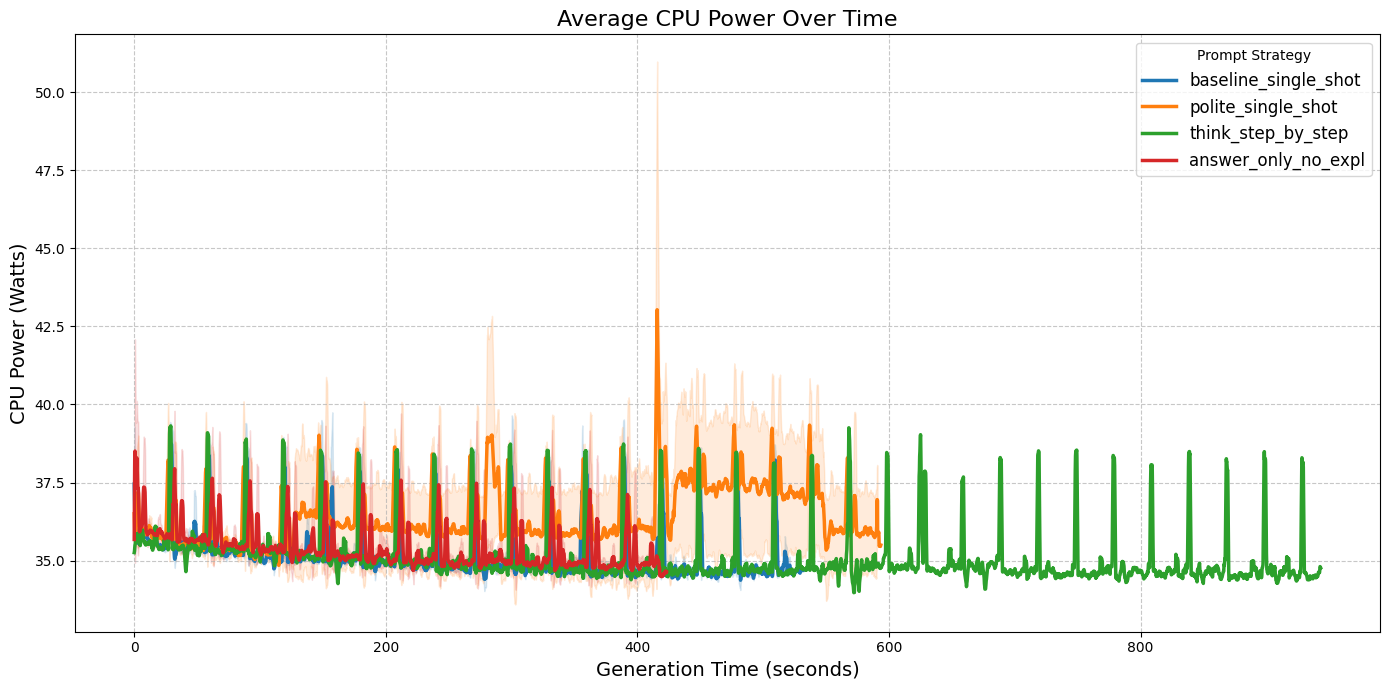 |
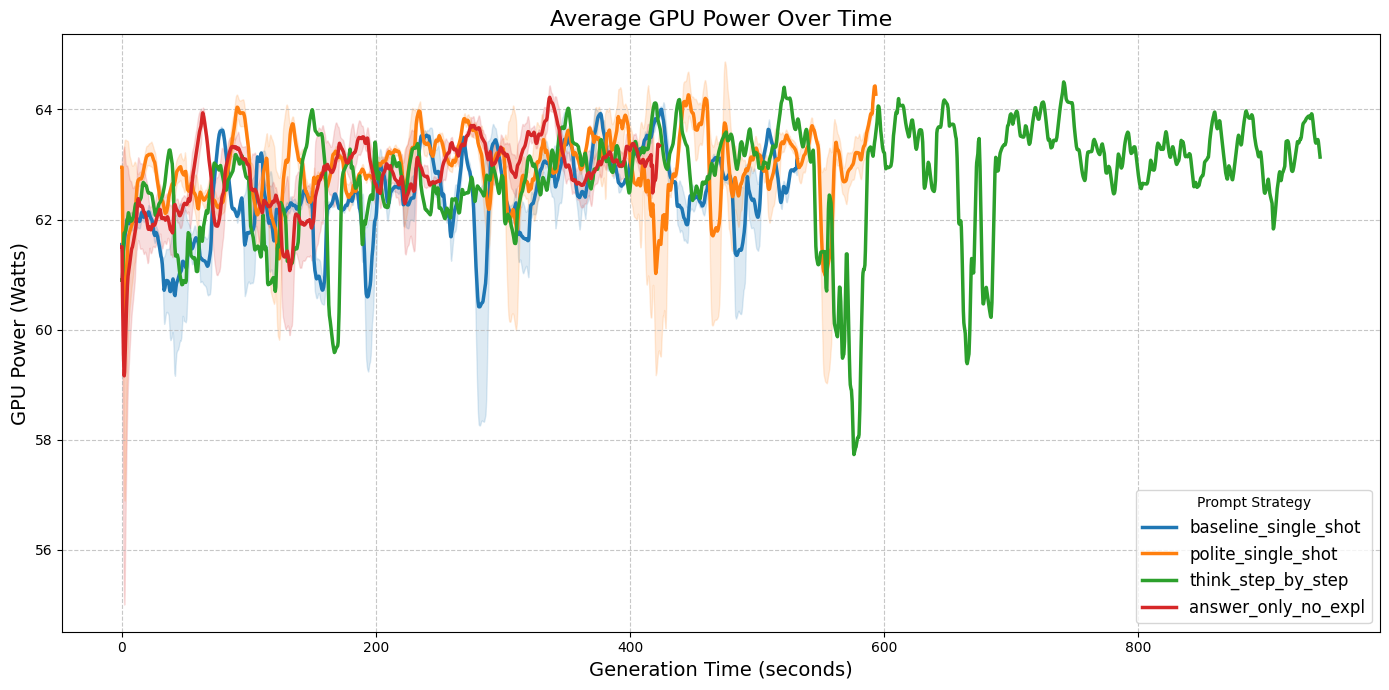 |
| Figure 2a: CPU Power Draw (mW) over time. | Figure 2b: GPU Power Draw (mW) over time. |
During our analysis, we also observed that the think_step_by_step seems to have a bit higher peaks in power draw for CPU
than for example answer_only_no_expl. Which leads us to another question: Do certain prompting strategies require
more CPU/GPU-intensive processing than others? Our hypothesis is that the think_step_by_step strategy may require
more complex reasoning and thus more intensive processing, which could lead to higher power draw. However, to properly test
this hypothesis, we would need to gather data on profiling and decoding stages separately, which did not happen in this
experiment. Therefore, we leave this to future work, as it would require a more detailed analysis of the model’s internal processing stages.
4.3 Prompt Efficiency and Return on Investment
We looked at how much energy each prompt used compared to how good the generated code was. We measured quality in two ways: Levenshtein Ratio (how similar the code text is) and CodeBLEU (how well the logic matches).
The Best Trade-offs (Pareto Frontier)
To find the best balance, we plotted the average scores and drew a Pareto Frontier. The dotted line connects the optimal choices in our test setup.
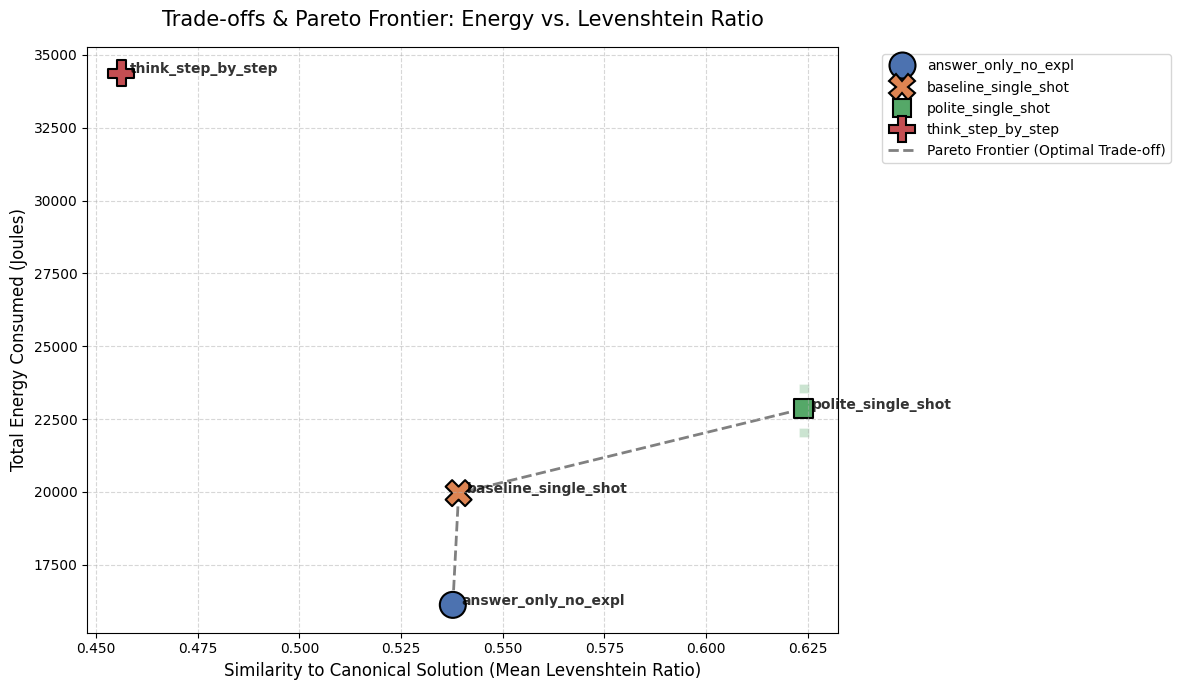 Figure 1: Pareto frontier showing the trade-off between energy and textual similarity (Levenshtein).
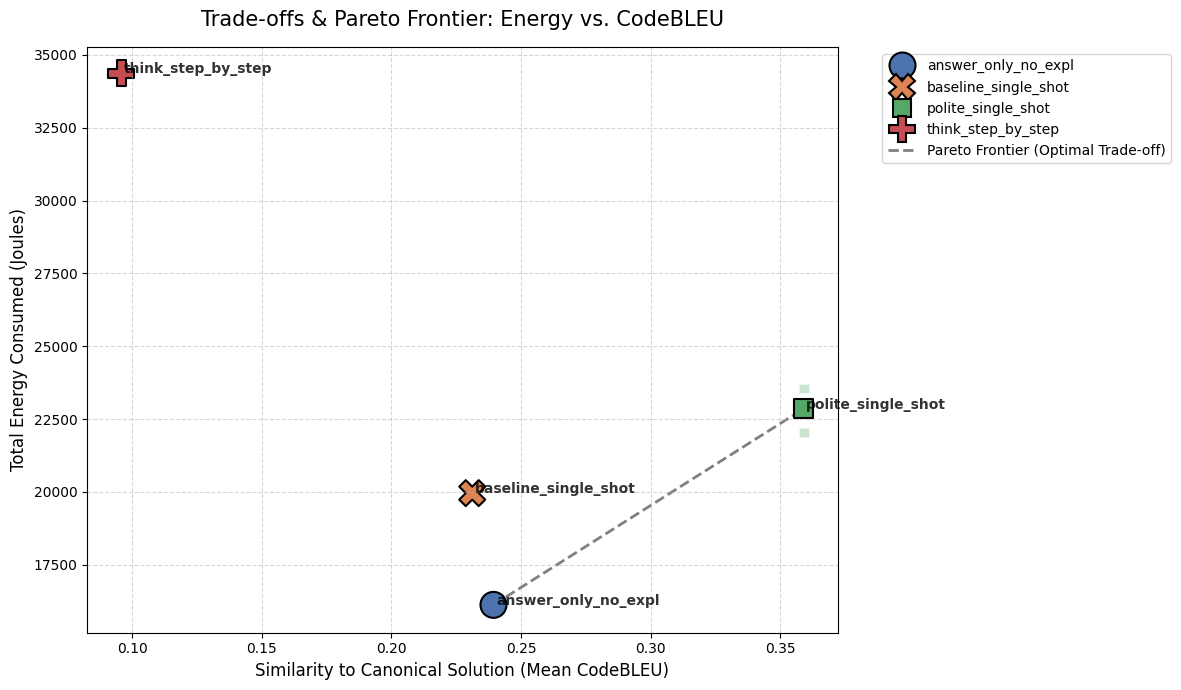 Figure 2: Pareto frontier showing the trade-off between energy and logical similarity (CodeBLEU).
- The
think_step_by_stepprompt sits far in the top-left. In our setup, it consumed the most energy and resulted in the lowest quality. - The dotted line shows our best options.
answer_only_no_explwas the cheapest way to maintain baseline quality, whilepolite_single_shotcost just a little more energy but provided the highest logical quality (CodeBLEU).
Relative Impact (Is it Better and Cheaper?)
We also compared everything directly to the baseline to see which quadrant each strategy landed in during our runs.
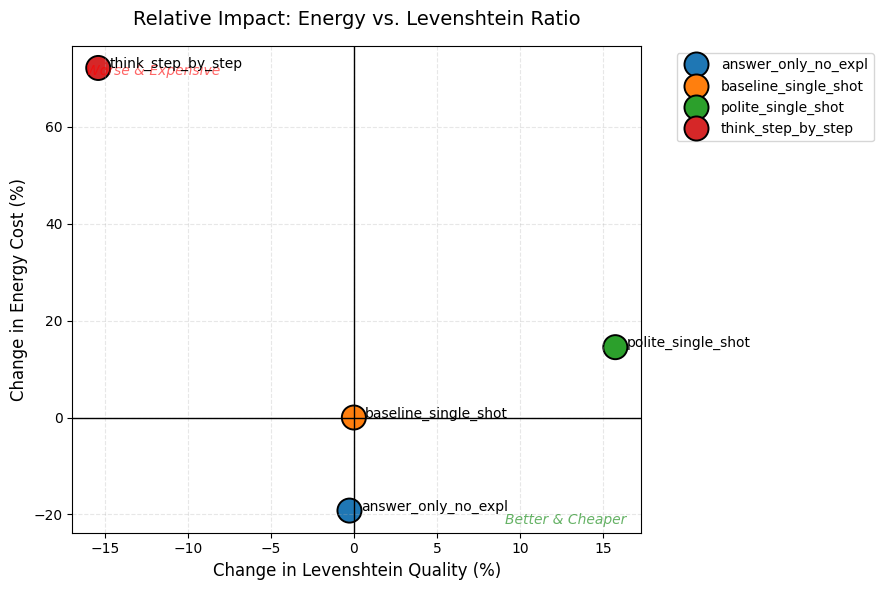 Figure 3: Relative impact on Levenshtein quality and energy cost compared to the baseline prompt.
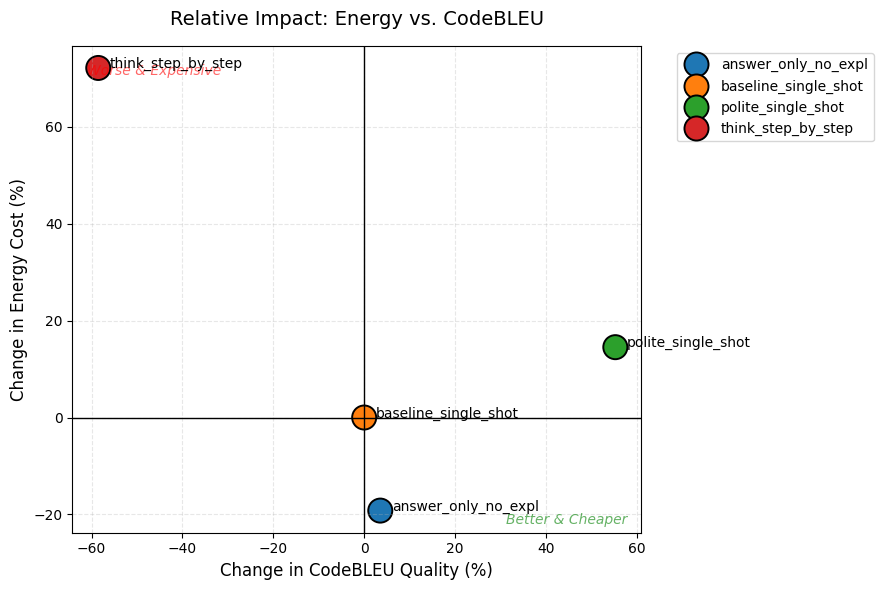 Figure 4: Relative impact on CodeBLEU quality and energy cost compared to the baseline prompt.
think_step_by_steplanded in the “Worse & Expensive” zone for both metrics.answer_only_no_expllanded in the “Better & Cheaper” zone for Levenshtein, saving energy while keeping the same textual quality as the baseline.polite_single_shotgave a 50%+ boost to CodeBLEU logic for only a ~15% energy increase compared to the baseline.
Efficiency (Quality per 100 Joules)
Finally, we calculated the direct “bang for your buck” to see how many quality points the model scored for every 100 Joules it burned in our environment.
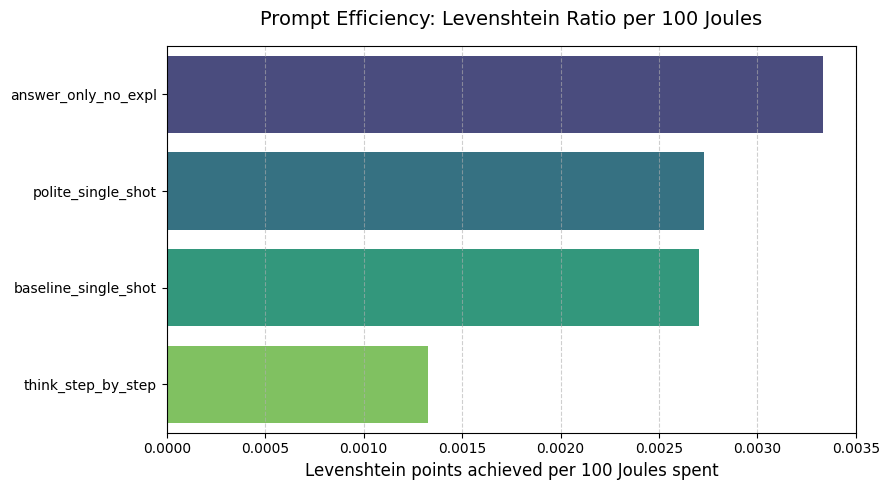 Figure 5: Efficiency ratio showing Levenshtein points achieved per 100 Joules spent.
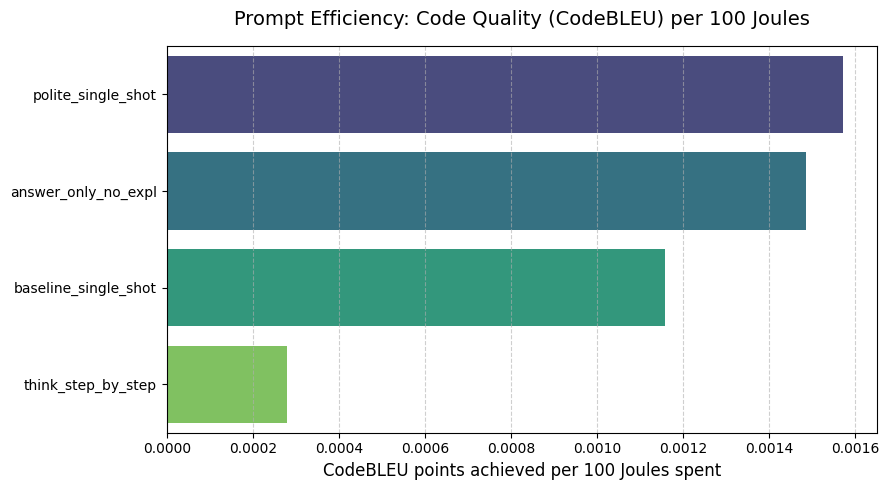 Figure 6: Efficiency ratio showing CodeBLEU points achieved per 100 Joules spent.
- For basic code structure (Levenshtein), telling the model to skip explanations (
answer_only_no_expl) gave the most points per Joule. - For code logic (CodeBLEU), being polite (
polite_single_shot) was the most efficient strategy in our tests.
Then, is the extra energy cost worth it?
Not necessarily. In our specific test setup, burning more energy did not guarantee better code. Forcing the model to explain itself (think_step_by_step) consumed a large amount of extra energy but actually lowered the code quality. For our environment, the better approach was to either force a direct answer (answer_only_no_expl) to save power, or add a polite phrase (polite_single_shot), which noticeably boosted code logic for an increase in energy cost.
4.5 Consistency of Run Results Across Prompt Types
To make sure our data wasn’t just a one-time fluke, we compared three separate runs of the same prompt. The violin plots below show the distribution of CPU and GPU power, as well as memory and CPU usage.
Because the ‘shape’ and the middle lines (medians) of the three violins match almost perfectly, we can be confident that our energy measurements are consistent and not affected by random background tasks.
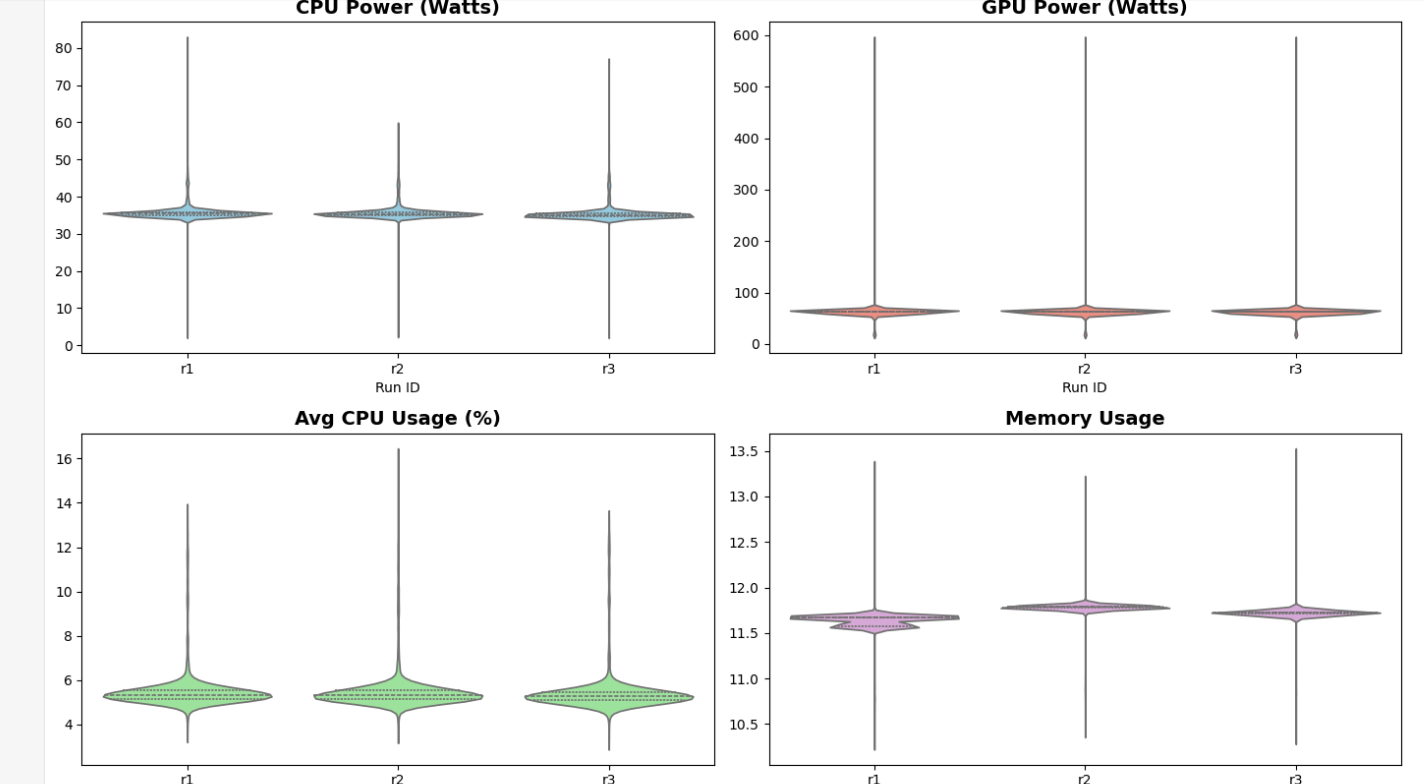 Figure 7: Distribution of system metrics for the answer_only_no_expl prompt across three independent runs.
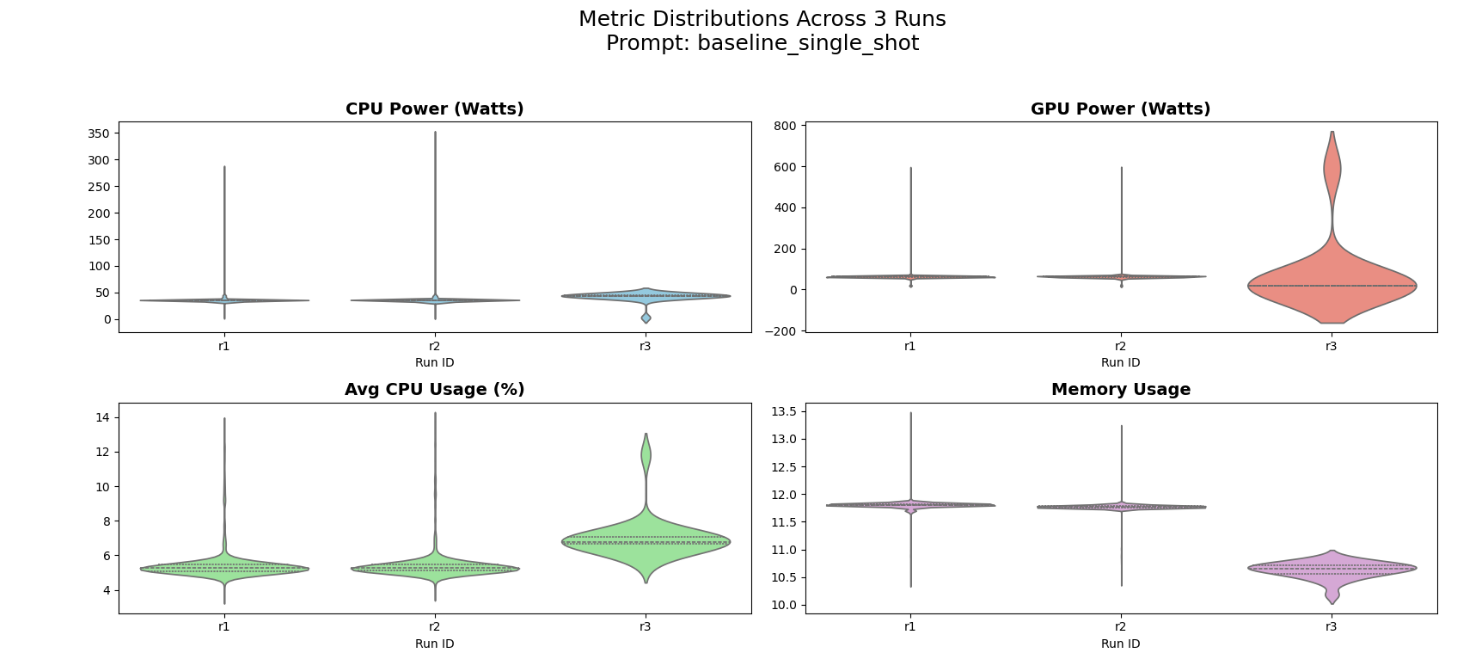 Figure 8: Distribution of system metrics for the baseline_single_shot prompt across three independent runs.
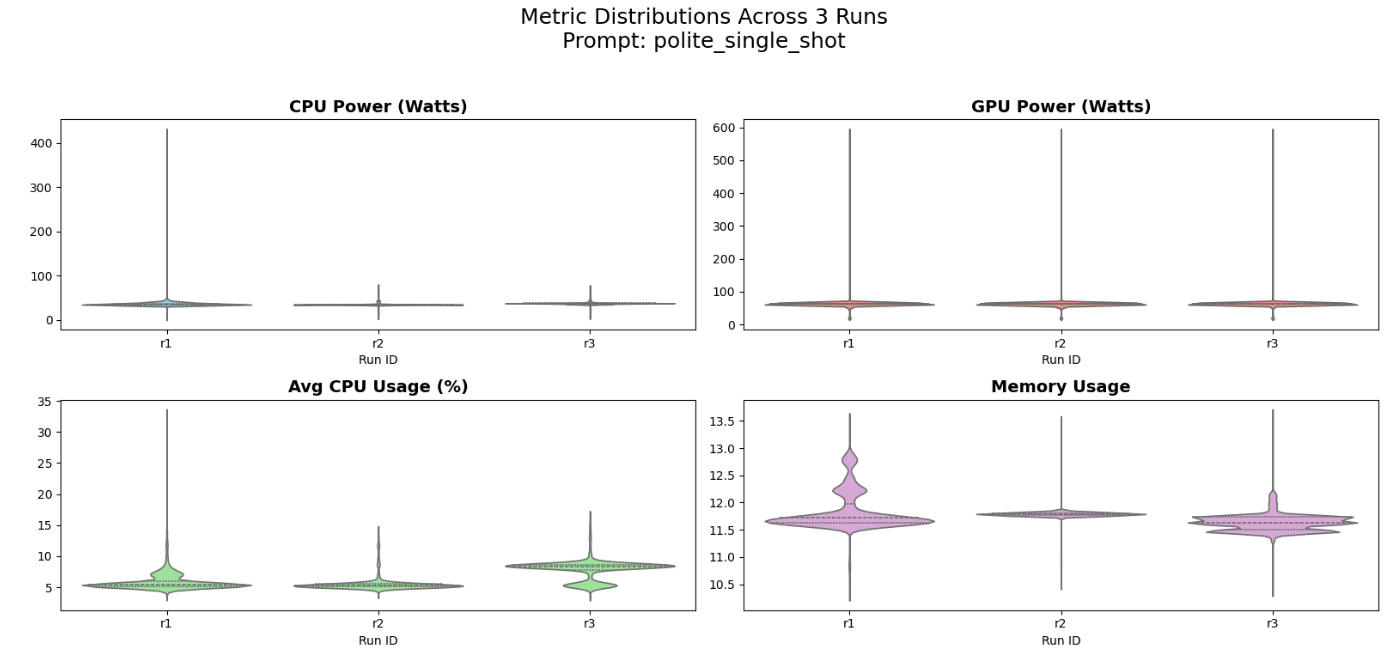 Figure 9: Distribution of system metrics for the polite_single_shot prompt across three independent runs.
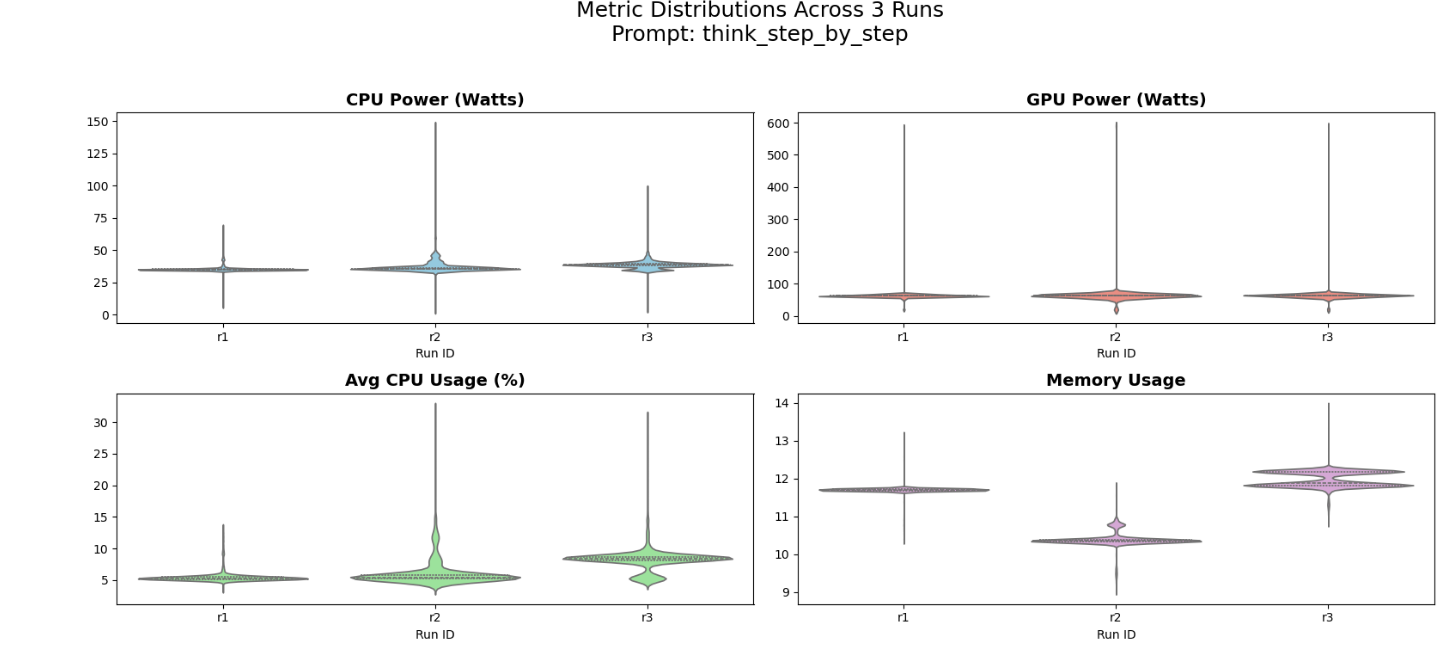 Figure 10: Distribution of system metrics for the think_step_by_step prompt across three independent runs.
The “Belly” (Width): The wide part of the violin shows where the computer spent most of its time (steady power).
The “Tail” (Height): The thin lines at the top show brief moments when the prompt caused a huge power spike, usually during token generation.
All three runs’ violins are at the same height on the graph, therefore the energy cost is reproducible.
5. Limitations
There are a few important limitations to keep in mind about how we setup this project:
- We only ran tests on
deepseek-coder-1.3b-instruct. This is a small model. Massive, state-of-the-art models (like 70B+ parameter ones) might actually get a lot smarter when asked to “think step-by-step”, which could make the extra energy cost worth it for them. - To measure quality, we used formulas (Levenshtein and CodeBLEU) that check how similar the generated text is to the correct answer. We did not actually run the generated code to see if it compiles or passes tests, so a snippet could score highly but still have a hidden bug.
- We used the HumanEval dataset, which is basically just small, isolated Python puzzles. Real-world software engineering involves huge, complex files. Prompting strategies might use energy differently when dealing with a massive codebase.
- We only tested four exact prompt templates. Because LLMs are sensitive to phrasing, just changing “Think step-by-step” to “Let’s work this out logically” could completely change the number of tokens the model spits out, which would change the energy footprint.
- The exact energy values (in Joules) we recorded only apply to the specific computer we used for testing. A different laptop or a massive server GPU will burn a totally different amount of power, even though the general trends should be similar.
6. Future Work
This study establishes a baseline to understand the energy costs of prompt engineering; this research can always be taken forward in several directions:
- Scaling to Large Language Models: This study focuses on a 1.3B-parameter model. However, advanced models like GPT-4 or Llama might handle the “think_step_by_step” differently. Further investigation needs to take place to determine if the extra energy those big models burn actually yields a non-linear increase in code quality or not.
- The current evaluation relies on textual similarity (CodeBLEU and Levenshtein). A more rigorous future approach would integrate functional verification, where energy cost is measured against the model’s ability to pass unit tests. This would allow for an “Energy per Successful Solution” metric, which is more relevant for production-grade software engineering.
- Our tests used HumanEval (Python puzzles). Real programming involves working with thousands of lines of code across many files. We should test if these energy patterns stay the same when the model has to read a massive codebase before answering.
- Given that we observed a significant GPU power volatility (~590W peaks), repeating this experiment across various hardware architectures (e.g., Apple Silicon vs. NVIDIA H100 vs. Edge AI chips) would determine if prompting strategies exhibit hardware-specific energy signatures
- A potential long-term goal is the development of an energy-aware prompt optimizer. Such a tool could automatically suggest the most energy-efficient prompt template for a specific task—balancing logical quality with a minimal carbon footprint—essentially acting as a “Green Linter” for prompt engineering
- As mentioned in section 4.2, we observed that
think_step_by_stephad higher CPU power peaks thananswer_only_no_expl. Future work could involve profiling the model’s internal processing stages to determine if certain prompts require more CPU/GPU-intensive computations per token, which could further explain the differences in energy consumption.