Energy Consumption for Online Podcast Playback
Preethika Ajaykumar, Yuting Dong, Jayran Duggins, Riya Gupta.
Group 17.
This project investigates how energy consumption varies during podcast playback in web browsers under controlled conditions. We compare different browsers and playback speeds while streaming identical podcast content, ensuring consistent brightness, duration and system settings across all runs. Energy data is collected using automated profiling tools and CPU package-level measurements to ensure reproducibility. Results are analysed in terms of total energy (Joules) providing insight into the environmental impact of everyday podcast streaming behaviour.
1. Introduction
Digital media consumption has become an integral part of everyday life, spanning platforms such as YouTube, Netflix, and digital music services. Podcasts, in particular, have seen significant growth in recent years [1], with millions of users consuming audio content daily through platforms such as Spotify and Apple Podcasts. A common user behaviour on these platforms is adjusting playback speed (e.g., 1x, 1.5x, or 2x) to listen to the content faster and more efficiently [2][3].
While increasing playback speed reduces listening time, the net effect on total energy consumption is not immediately obvious. Faster playback increases processing demand but shortens overall playback duration.
Most existing research on streaming sustainability focuses on network infrastructure, data centres, or media compression efficiency [4]. Existing podcast research largely focuses on language learning, education, and user engagement. However, less attention has been given to client-side energy consumption, that is, the energy used by end-user devices during playback. Since end-user devices are widely distributed and always active, even small differences in power usage may accumulate into meaningful environmental impacts when scaled across millions of users.
This study investigates how playback speed affects device-level energy consumption during desktop web-based podcast streaming. Specifically, we compare Spotify and Apple Podcasts web players under controlled conditions and measure total energy consumption of the content consumed.
By isolating playback speed as a behavioural variable, this work contributes to sustainable software engineering by examining how everyday user choices interact with platform design and software implementation to shape energy efficiency outcomes.
Research Question: How does increasing playback speed (1x vs 2x) influence device-level energy consumption during desktop-based podcast streaming across different platforms and browsers?
2. Methodology
2.1 Experimental Overview
This study measures device-level energy consumption during continuous podcast playback under controlled desktop conditions. The experiment assesses how playback speed and browser implementation influence energy usage.
All measurements were conducted on a single laptop to eliminate hardware variability. Playback sessions were fully automated to ensure identical interaction across all configurations.
2.2 Design Decisions and Platform Selection
The experimental framework and platform choices were guided by three main categories: experimental control, reproducibility, and relevance to real-world usage.
Selection of Spotify and Apple Podcasts
Spotify and Apple Podcasts were chosen because they are two of the most widely used podcast platforms globally [5][6]. Both platforms support variable playback speed, which is central to our research question. Comparing these two platforms allows us to evaluate whether implementation differences influence energy efficiency under the same playback conditions.
Web-Based Platforms vs Native Application
The web versions of Spotify and Apple Podcasts were selected instead of their desktop applications. Although native applications are more commonly used, web-based playback provides stronger experimental control and automation. Browser automation frameworks such as Playwright enable consistent scripting of navigation, playback initiation, and speed adjustment. This ensures that all trials follow an identical structure and can be reproduced reliably.
Selection of Chrome and Brave Browsers
Google Chrome and Brave were selected as representative Chromium-based browsers. Google Chrome was selected due to its current global market share [7]. To maintain experimental control, a second Chromium-based browser was selected rather than choosing a browser built on a different rendering engine. By selecting two browsers based on the same engine, variability introduced by engine-level architecture is reduced. This allows for a more controlled comparison focused on browser-level implementation differences, background process behaviour, and energy management strategies rather than engine-specific effects.
2.3 Experimental Variables
Independent Variables
The following factors were varied:
- Browser
- Google Chrome
- Brave Browser
- Playback Speed
- 1x (normal speed)
- 2x (accelerated playback)
- Podcast Platform
- Spotify
- Apple Podcasts
This results in eight configurations:
- Chrome - Spotify - 1x speed
- Chrome - Spotify - 2x speed
- Brave - Spotify - 1x speed
- Brave - Spotify - 2x speed
- Chrome - Apple Podcasts - 1x speed
- Chrome - Apple Podcasts - 2x speed
- Brave - Apple Podcasts - 1x speed
- Brave - Apple Podcasts - 2x speed
Controlled Variables
The following factors were held constant across all trials:
- Screen resolution
- Playback content (same podcast episode)
- System volume and speaker
- Network connection (Wi-Fi)
- Background applications
- Measurement duration
- Sampling interval
- Hardware configuration
2.4 Test Platform
All experiments were conducted on a single laptop to remove hardware related variability.
| Component | Specification |
|---|---|
| Model | Lenovo Yoga Pro 7 14ASP9 |
| CPU | AMD Ryzen™ AI 9 365 (20 logical cores) |
| Integrated GPU | AMD Radeon™ 890M |
| Memory | 32 GB RAM |
| Architecture | x86_64 |
2.5 Software Environment
| Component | Specification |
|---|---|
| Operating System | Ubuntu 25.10 |
| Kernel | Linux 6.17.0 |
| Desktop Environment | GNOME 49 |
| Display Server | Wayland |
| Firmware Version | PSCN17WW |
2.6 Measurement Setup
Energy measurements were collected using EnergiBridge [8]. EnergiBridge samples processor energy counters at fixed intervals. For our experiment we used an interval of 500ms.
Total energy consumption for each trial was computed using the cumulative CPU_ENERGY counter:
Energy = Final Value - Initial Value
2.7 Automation Procedure
Playback sessions were fully automated using Playwright [9], a browser automation framework that enables deterministic control of web-based interactions. Playwright allows programmatic launching of browser instances, navigation to specific URLs, and scripted interaction with page elements. This ensures that each trial follows an identical execution path, eliminating variability caused by manual user input.
Persistent browser profiles were used to maintain authenticated sessions and ensure consistent playback behaviour across runs. This avoids repeated login flows and ensures that DRM modules and session states remain stable throughout the experiment.
Rather than relying solely on user interface controls, playback was initiated through scripted interaction with the player interface, after which the HTML ‘<audio>’ element’s ‘playbackRate’ property was set programmatically to ensure consistent speed configuration. Playback initiation was verified before energy measurement began to ensure that decoding activity was active.
Each trial followed the same automated sequence:
- Launch browser
- Wait for browser initialisation (5 seconds)
- Navigate to the podcast platform web player at the selected podcast episode URL
- Wait for page load stabilisation
- Click play
- Wait to ensure playback start (3 seconds)
- Set playback speed (1x or 2x)
- Start energy measurement (EnergiBridge)
- Measure for 90 seconds
- Stop measurement
- Close browser
- Cooldown period of 30 seconds
The browser startup, page load, and playback start waits allow buffering, decoding, and CPU frequency scaling to stabilise before measurements are recorded. The cooldown phase reduces carryover effects between runs.
Automation ensures reproducibility, consistent timing, and identical interaction patterns across all configurations.
2.8 Repetition Strategy and Variance Reduction
Each configuration was repeated 30 times to reduce measurement variation caused by:
- OS scheduling behaviour
- Background system processes
- Core temperatures
- Short term system noise
3. Results
3.1 Is Playing at 2x Speed More Energy Efficient?
The central question was: Does playing podcasts at 2x speed reduce CPU energy consumption?
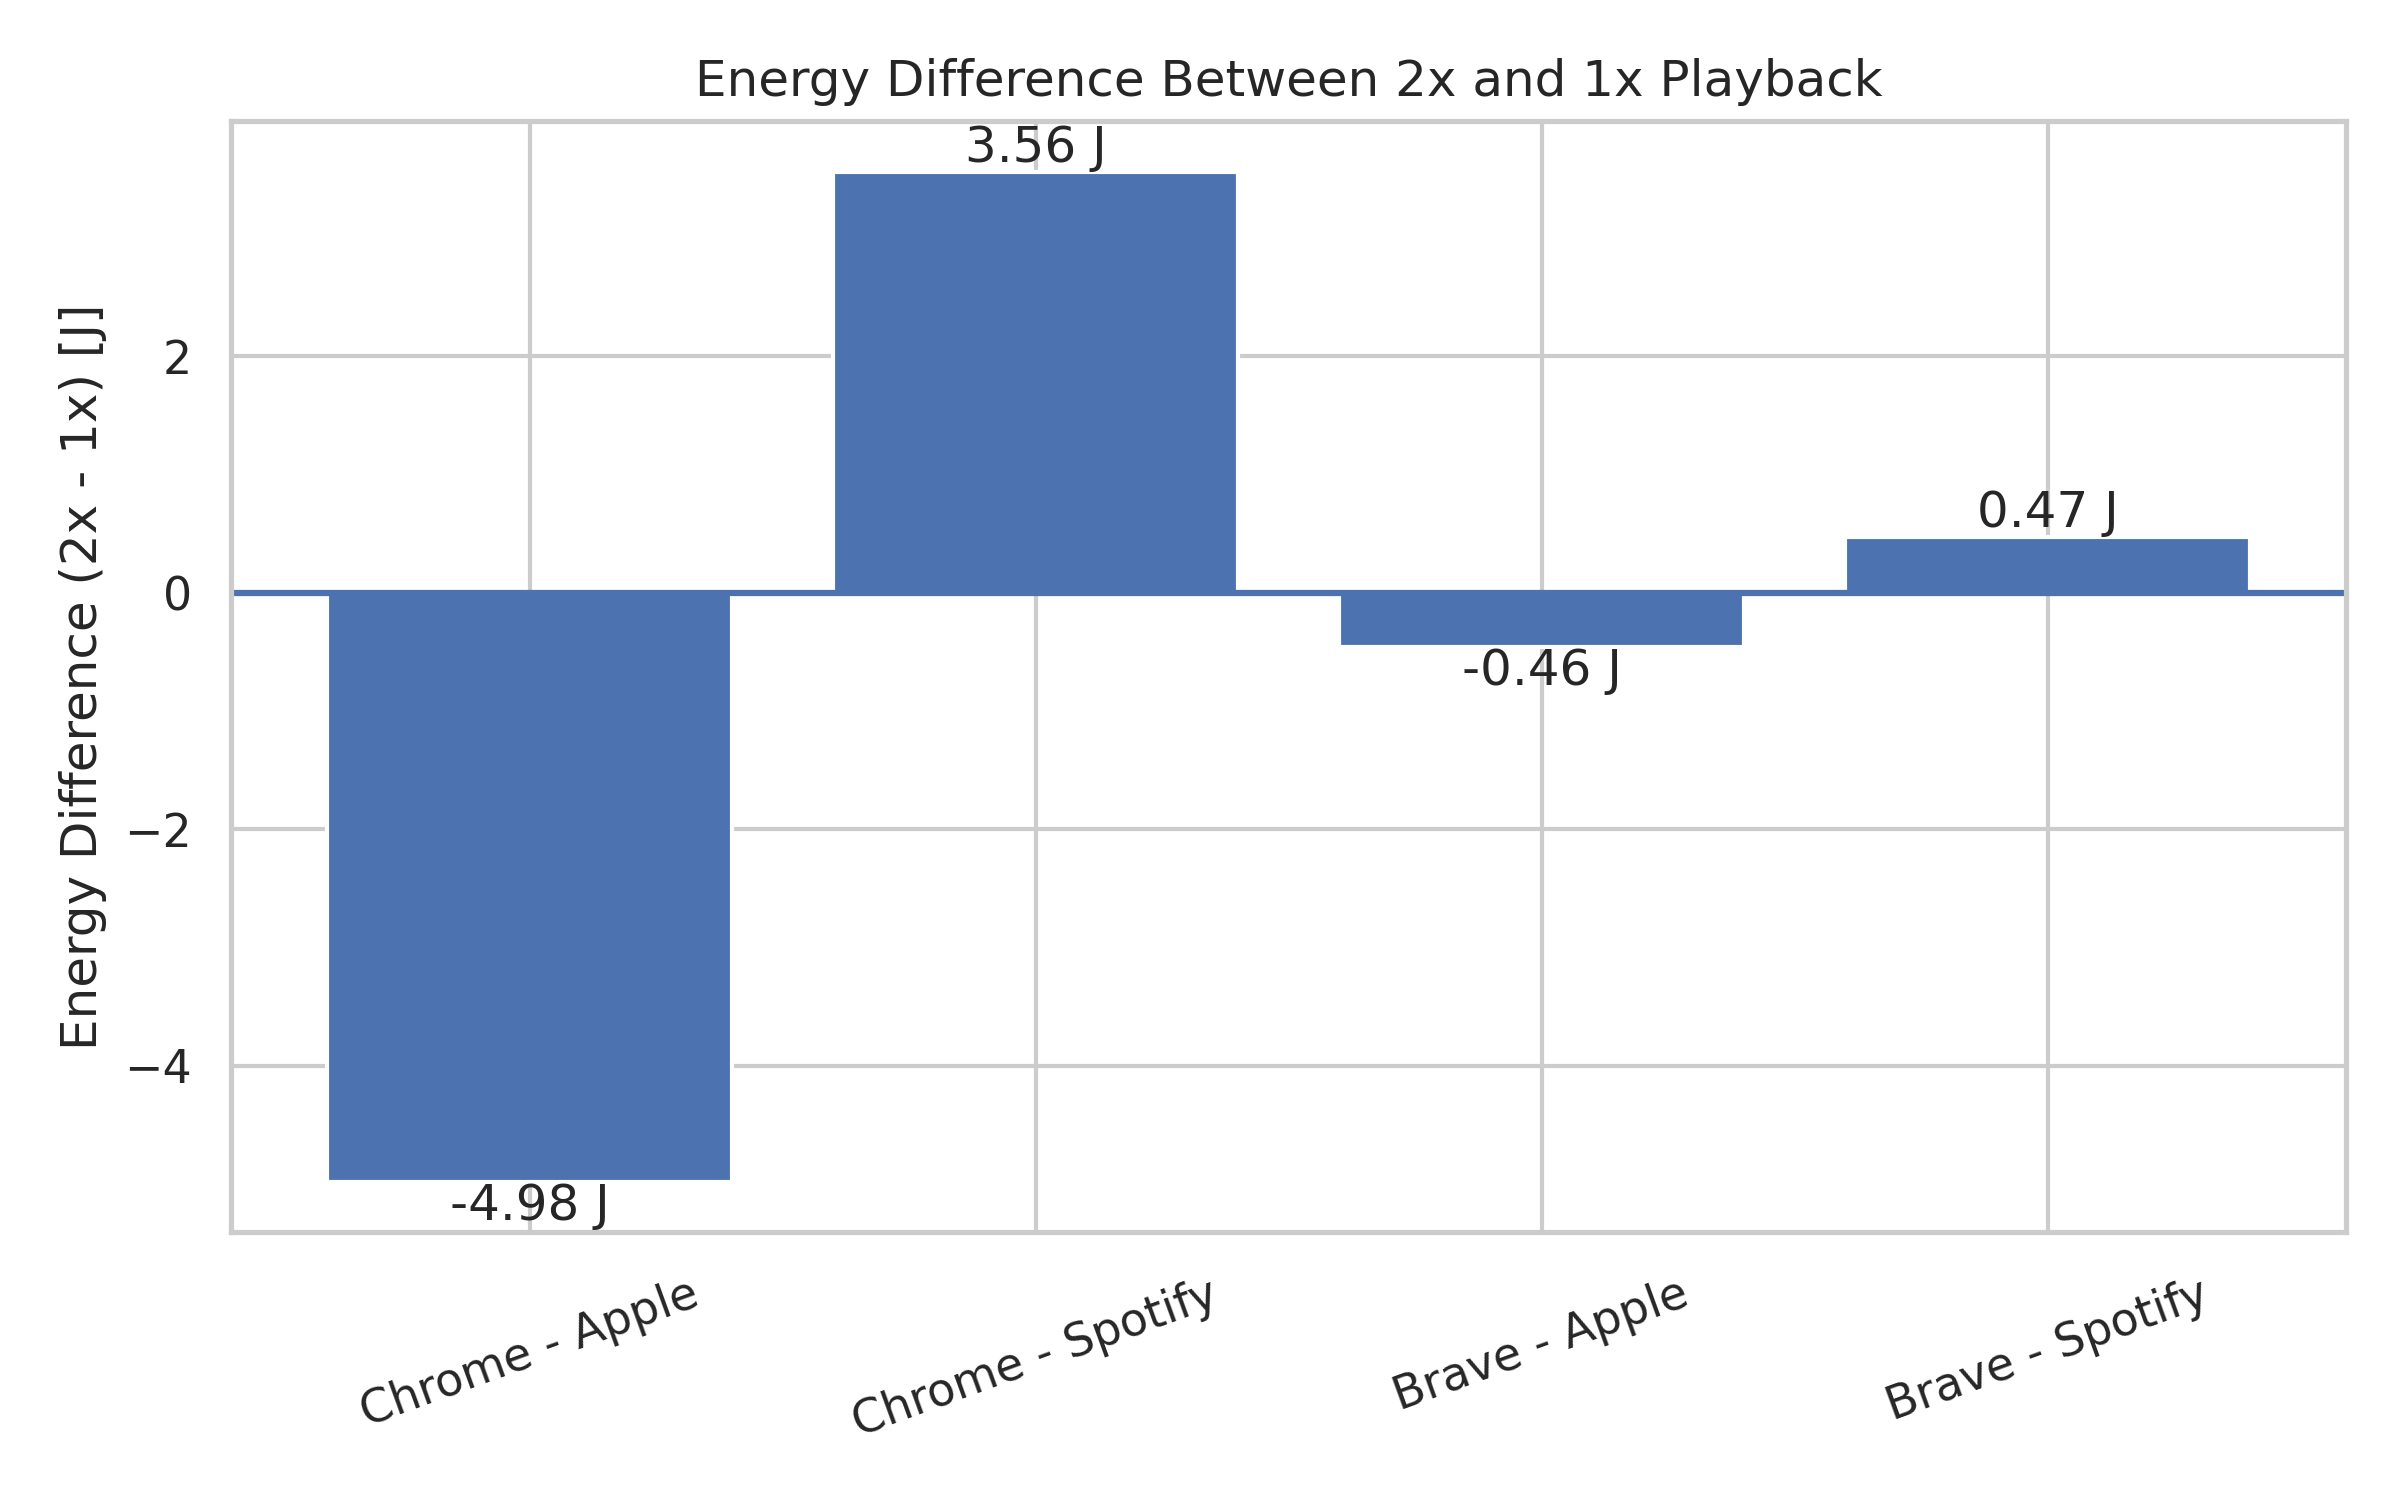
Figure 1: Energy difference between 2x and 1x playback across browser-platform combinations
Figure 1 shows the difference in energy between 2x and 1x playback for each browser-platform combination.
Values below zero mean that 2x playback uses less energy.
Values above zero mean that 2x playback uses more energy.
From the figure, we can see that:
- Chrome - Apple shows a noticeable energy reduction (about -5 J).
- All other combinations are very close to zero.
This means that only Apple Podcasts in Chrome clearly benefit from faster playback.
For Spotify (in both browsers) and Apple in Brave, the energy difference is extremely small.
Although a difference of 5J may appear small, statistical analysis shows that it is both statistically significant and practically meaningful. The effect size was large, indicating a substantial difference between 1x and 2x playback and not suggesting random variation.
The results therefore indicate that, in most cases, increasing playback speed does not reduce energy consumption, with the exception of the Chrome–Apple Podcasts configuration.
3.2 How Do the Playback Distributions Compare?
To better understand what is happening, Figures 2 and 3 show the distribution of energy measurements using boxplots.
Chrome
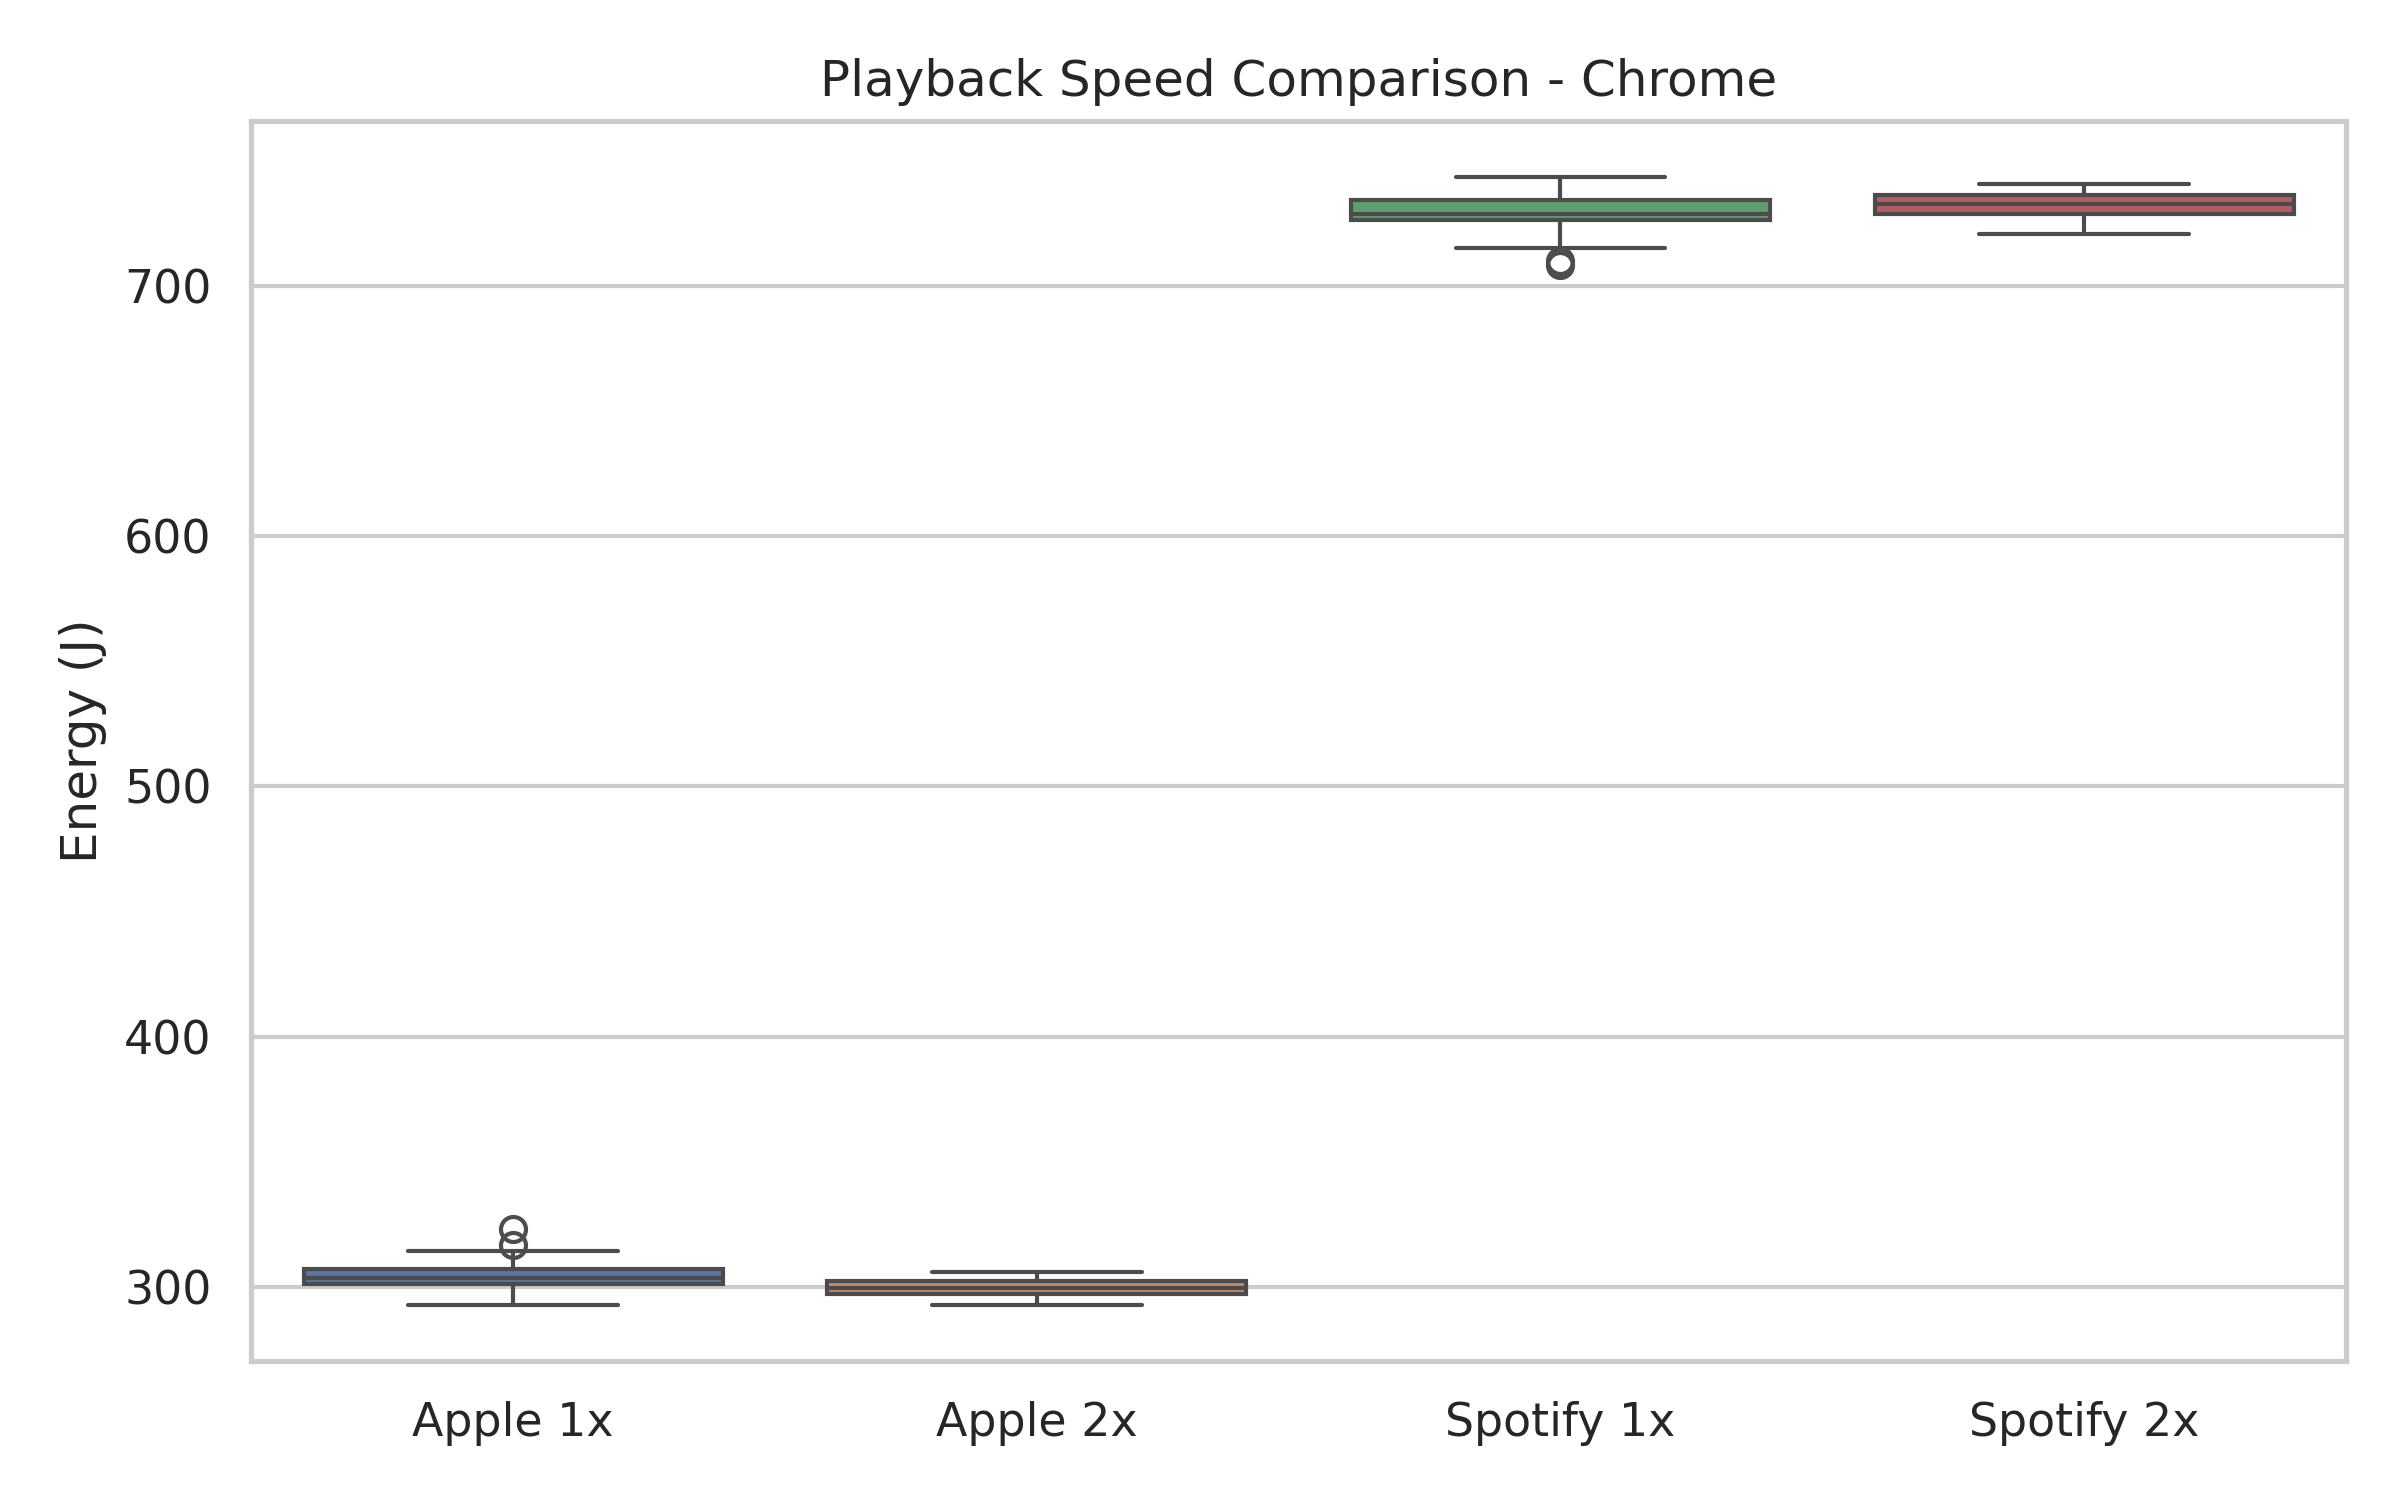
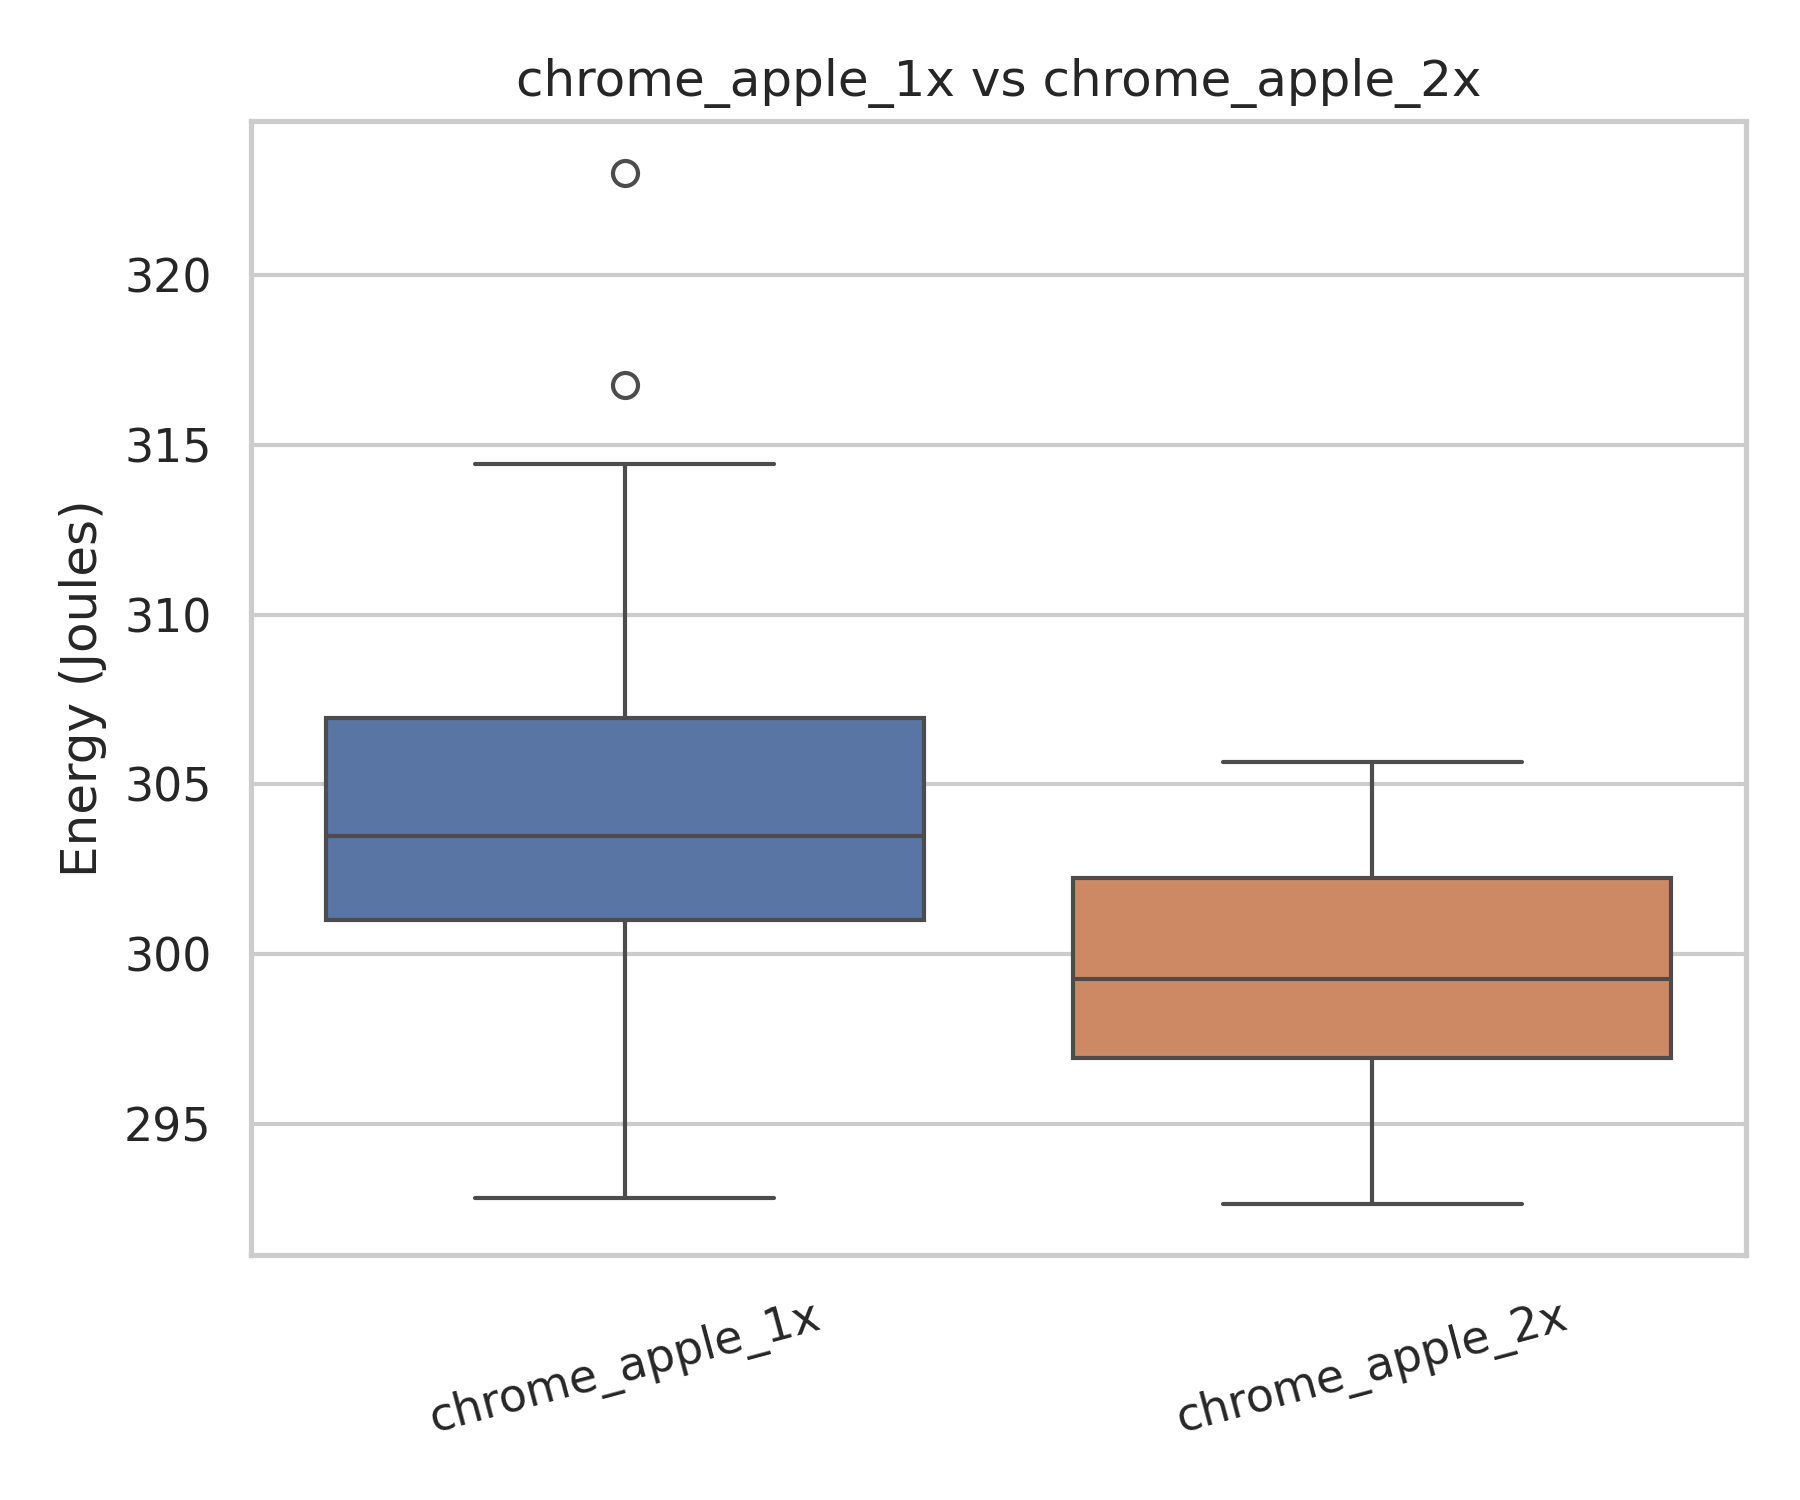
Figure 2: Playback speed comparison in Chrome
As shown in Figure 2, Apple Podcasts in Chrome shows a downward shift when moving from 1x to 2x playback. The median energy consumption is lower at 2x, and the distributions overlap less than in other cases. This visual separation shows that the reduction is consistent and not due to random variation.
Spotify in Chrome behaves differently. In Figure 2, the 1x and 2x boxplots overlap heavily, with very similar medians and spreads. Although there is a small numerical difference, statistical significance testing and effect size testing revealed that the difference is not statistically significant and could simply reflect random variability between runs.
In practical terms: playback speed meaningfully affects energy consumption for Apple Podcasts in Chrome, but not for Spotify.
Brave
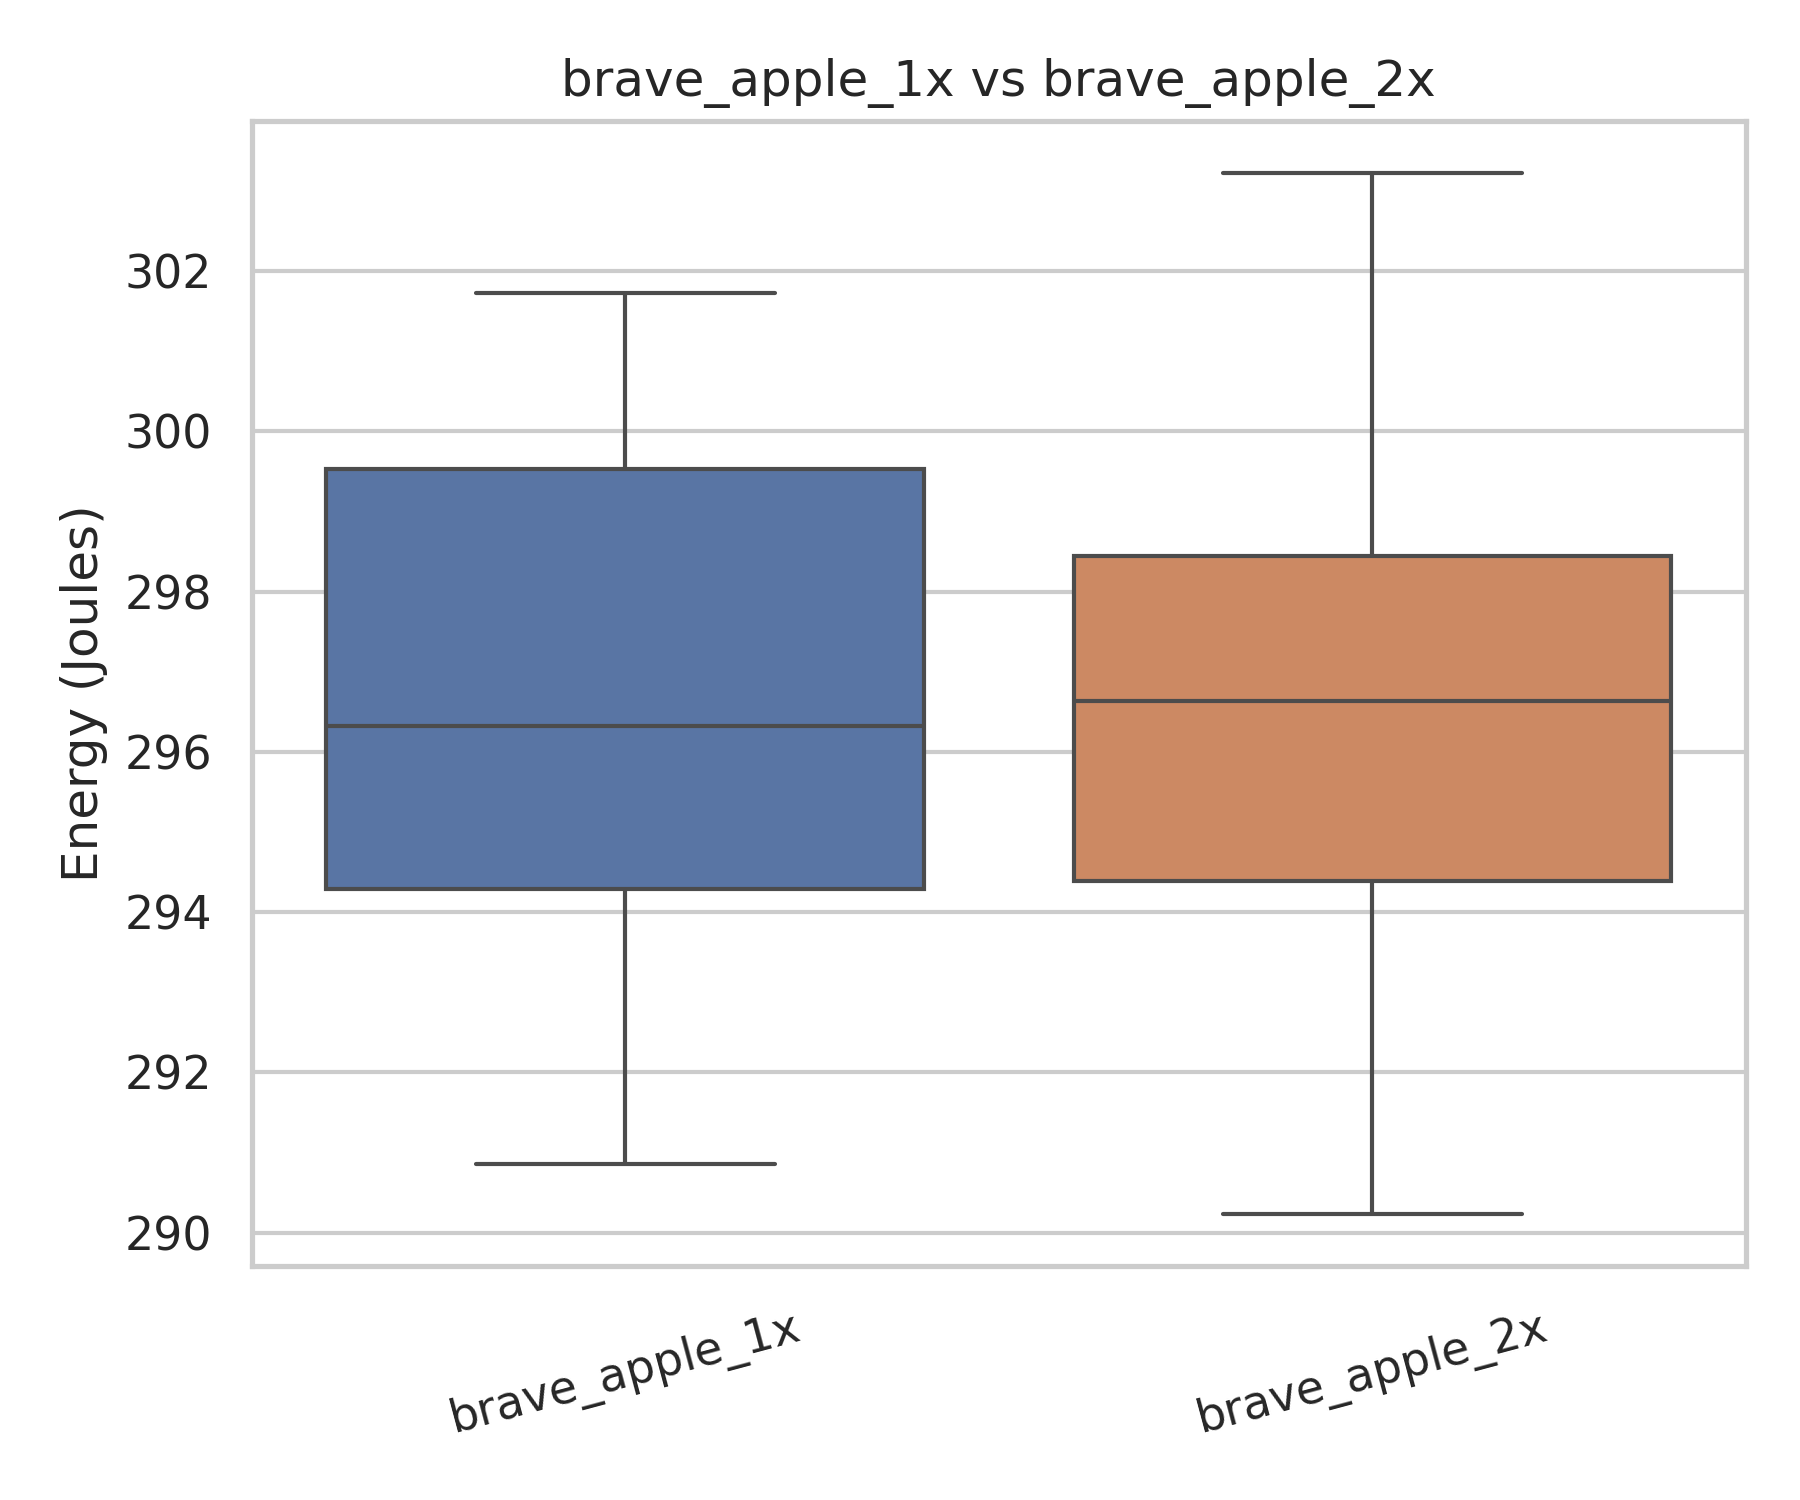
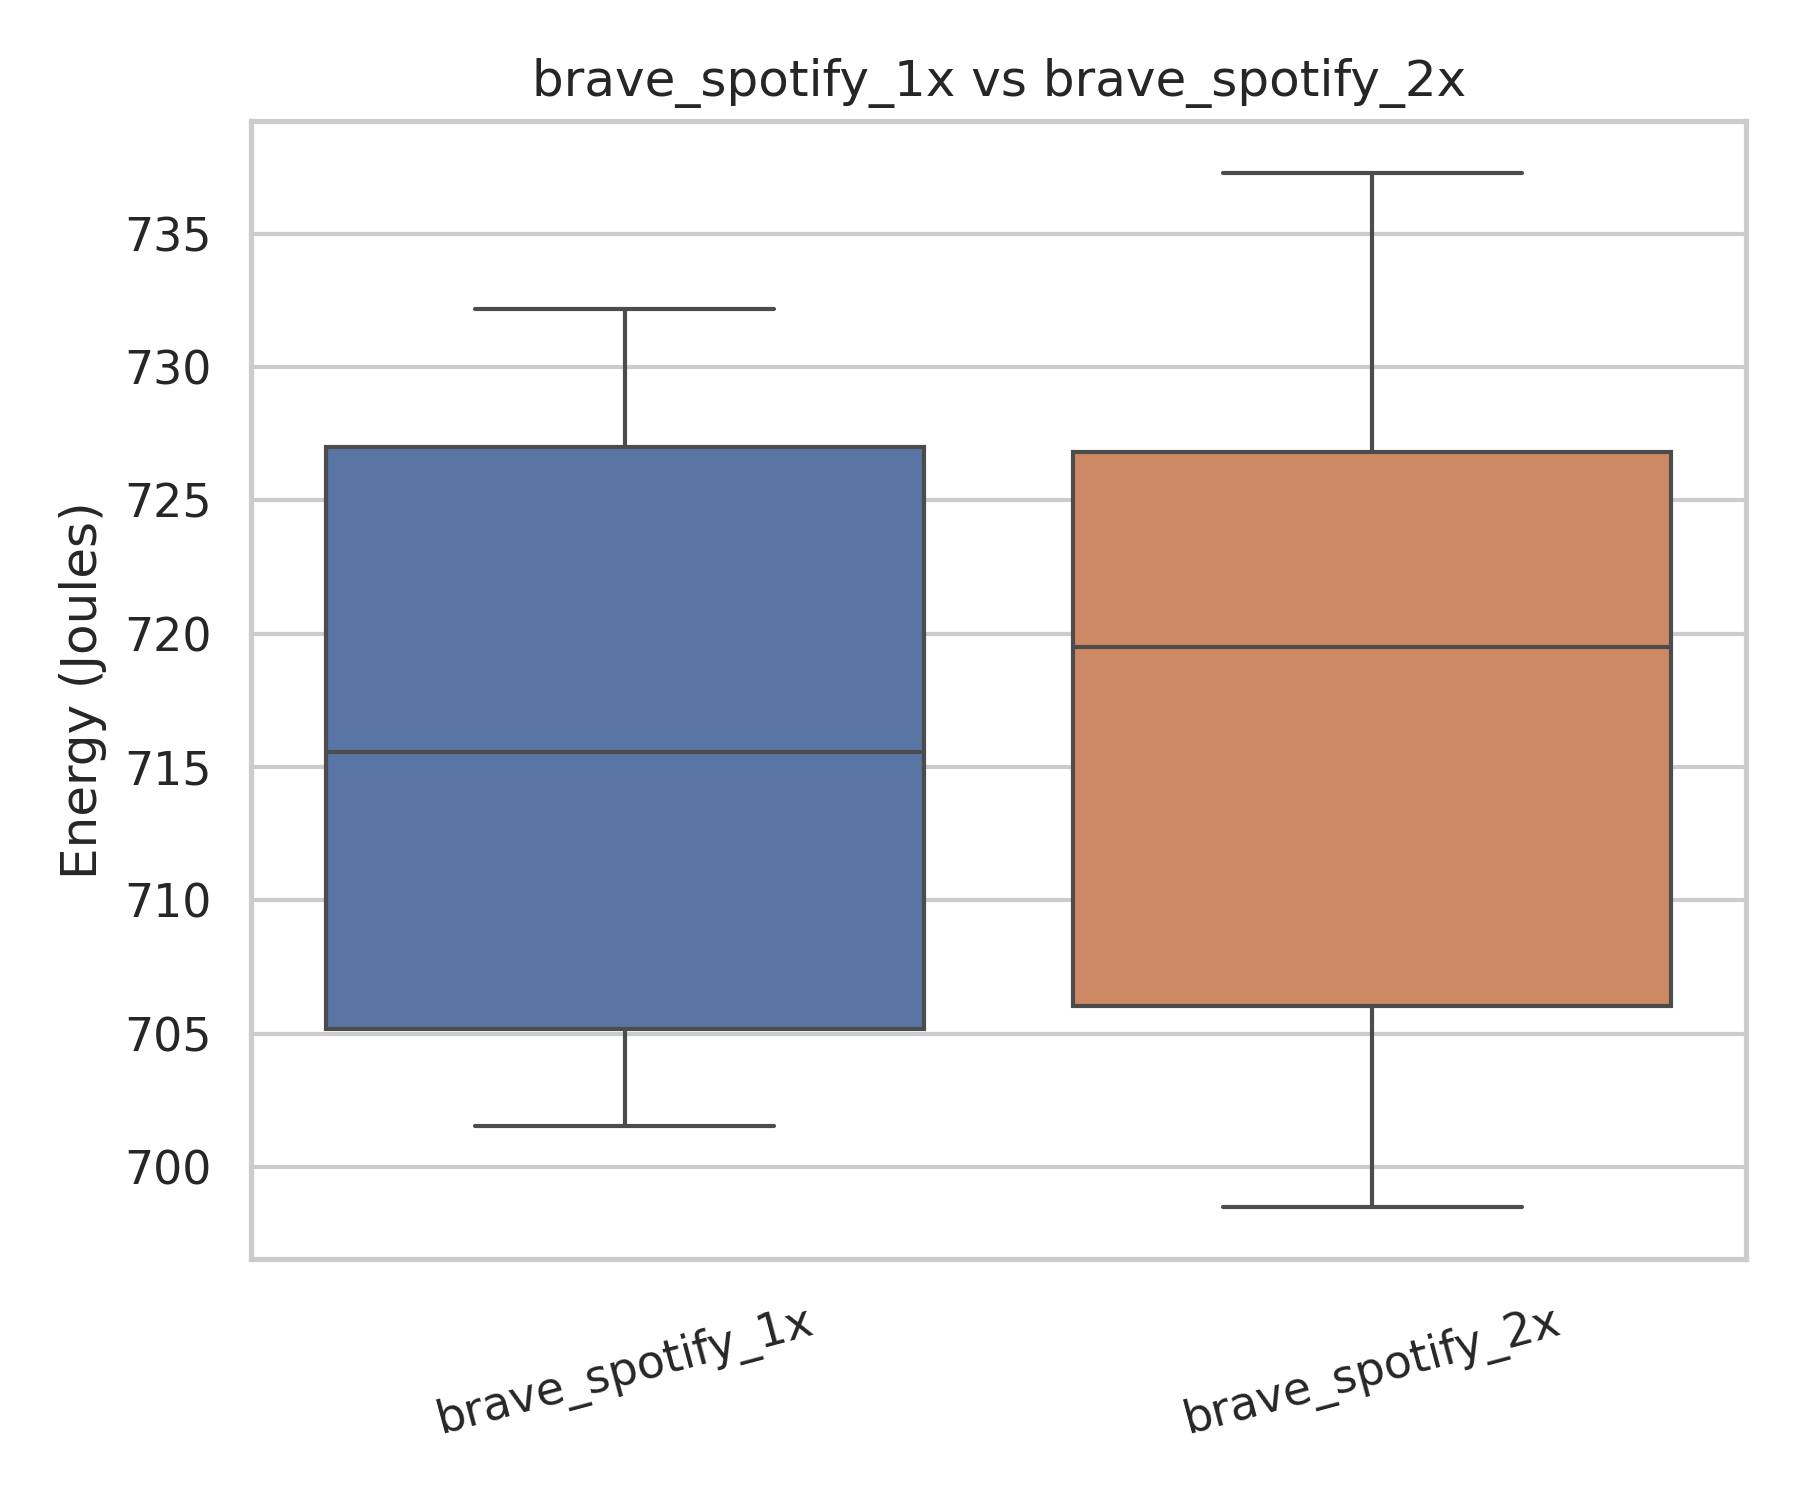
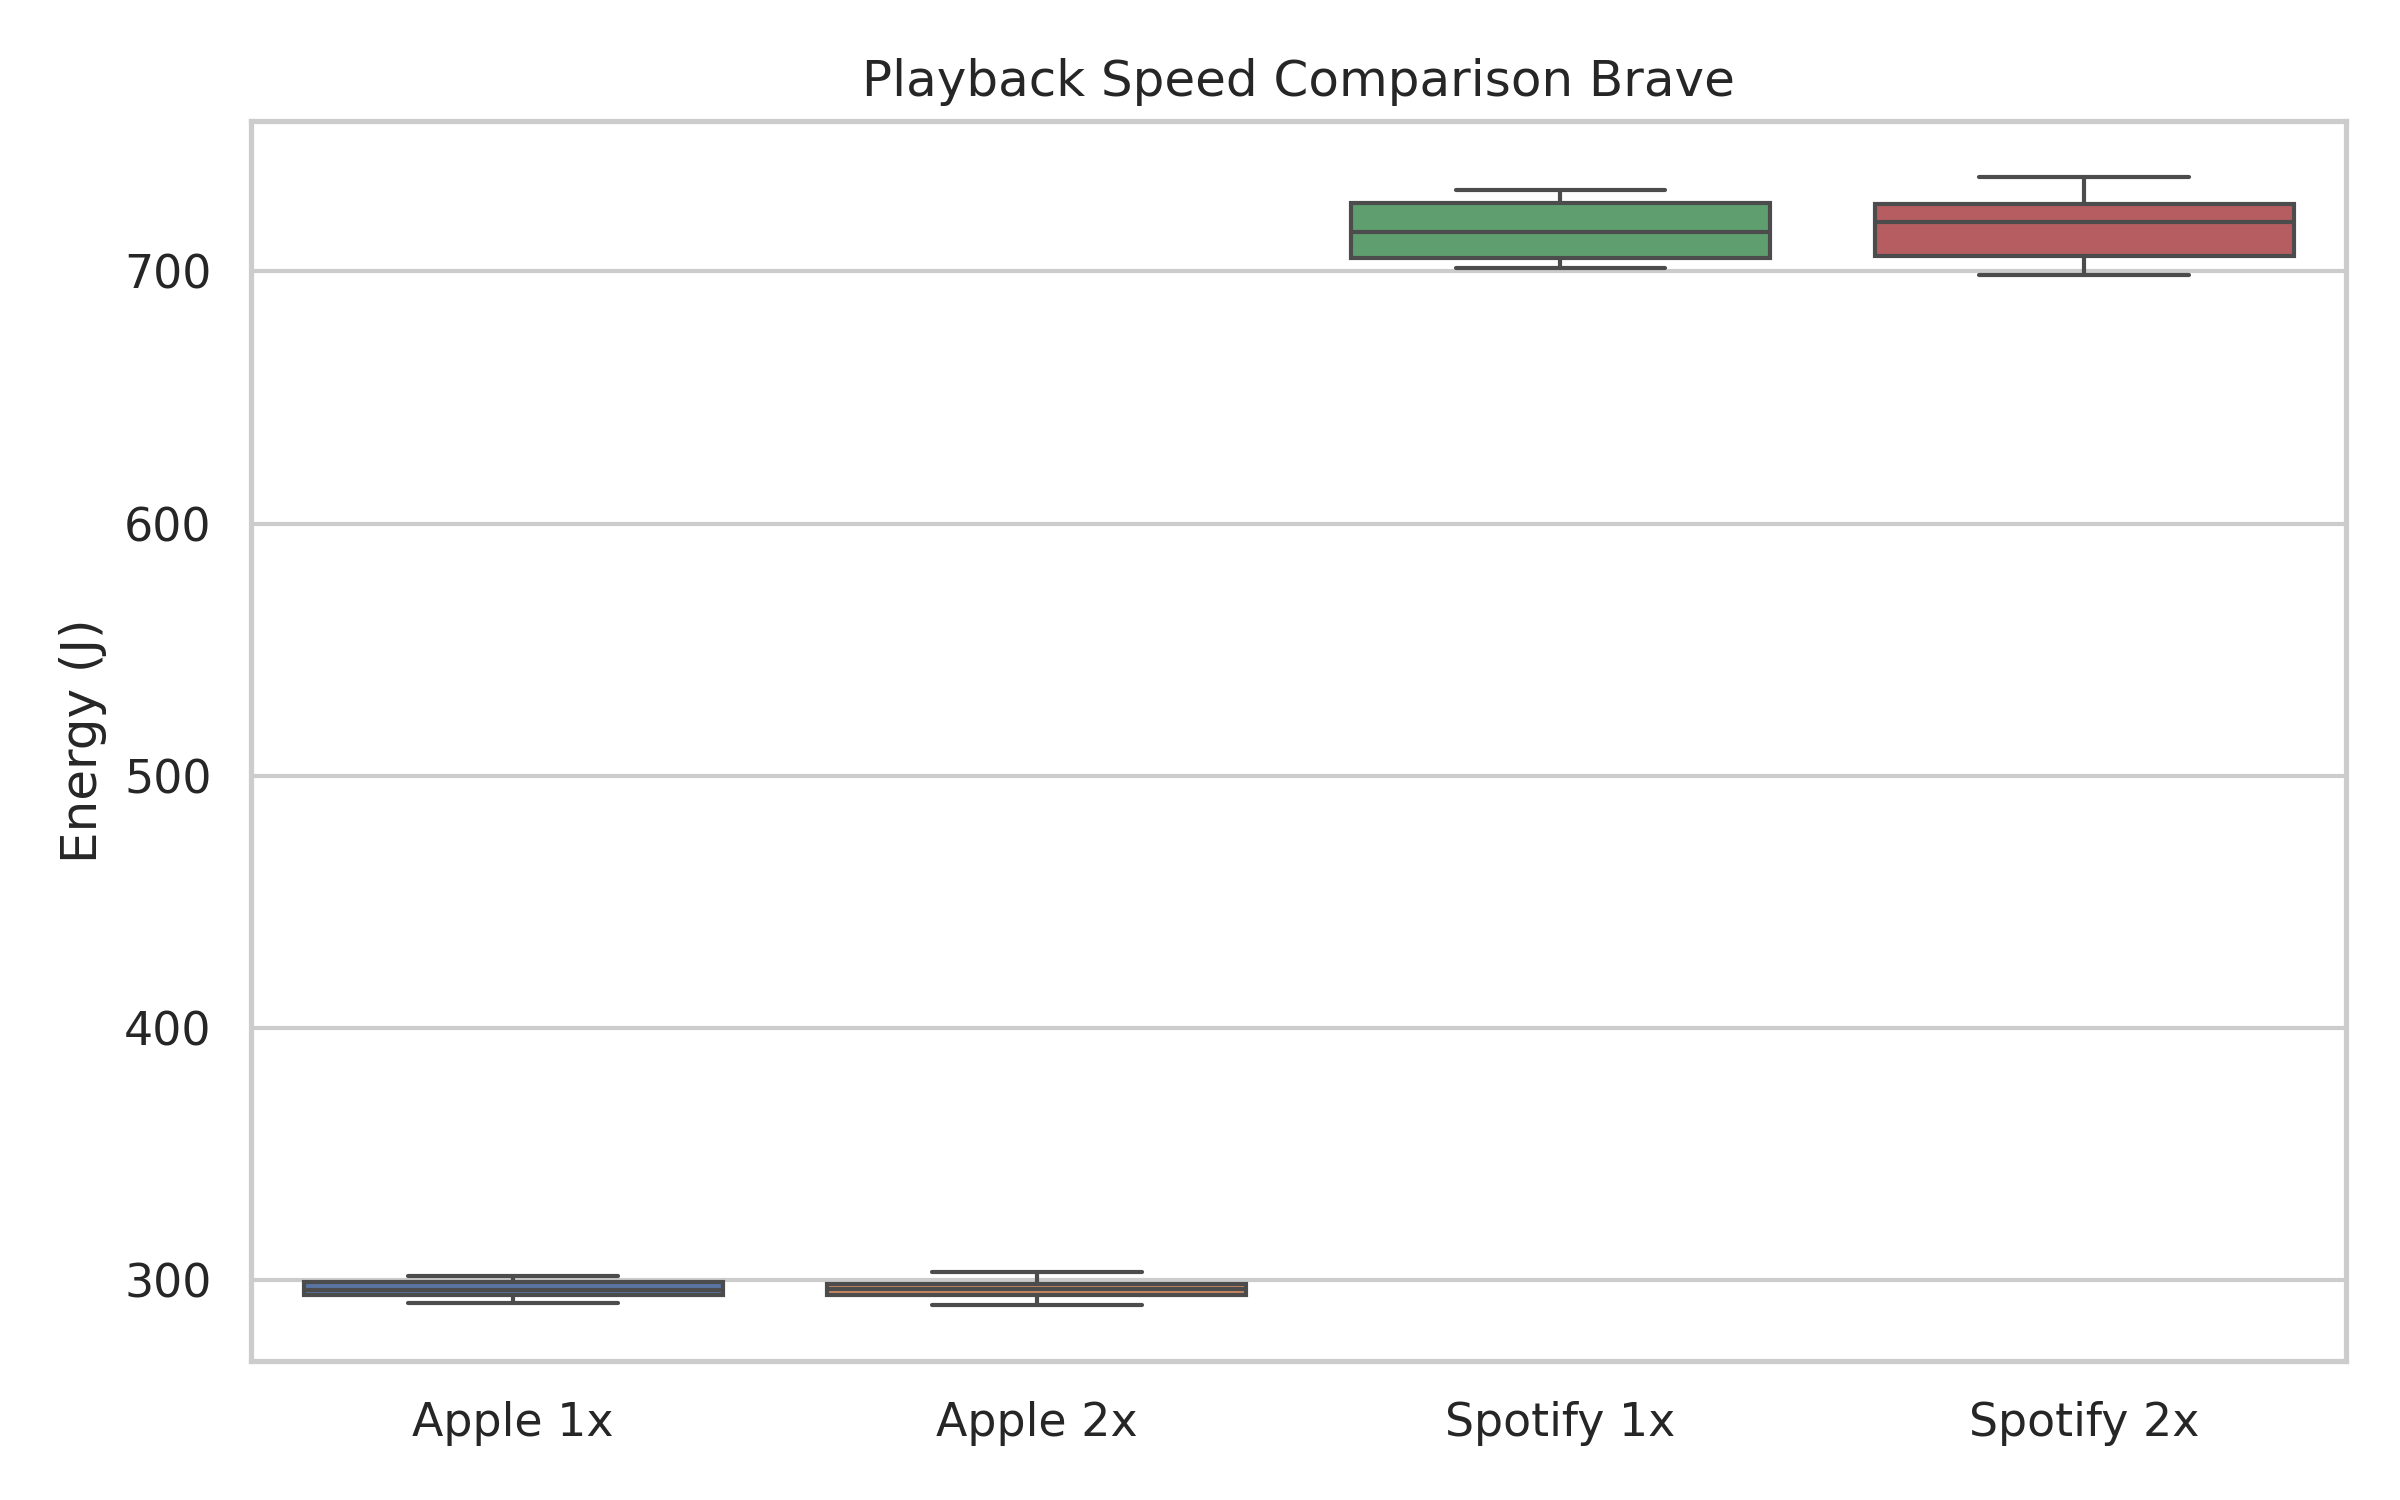 Figure 3: Playback speed comparison in Brave
As shown in Figure 3, the pattern in Brave is even more stable than in Chrome. For both Apple Podcasts and Spotify, the 1x and 2x boxplots almost completely overlap. The medians are nearly identical, and the spreads are very similar.
This strong overlap indicates that playback speed has virtually no impact on energy consumption in Brave, regardless of platform.
While Spotify shows a very small numerical difference between 1x and 2x playback, Figure 3 makes it clear that the distributions overlap heavily. Statistical testing confirms that this difference is not significant, meaning it could simply be due to natural variation between runs.
In practical terms: changing playback speed does not meaningfully affect energy usage for either Apple Podcasts or Spotify.
3.3 Does the Platform Matter More Than Speed?
If playback speed has limited impact, does the streaming platform itself make a difference?
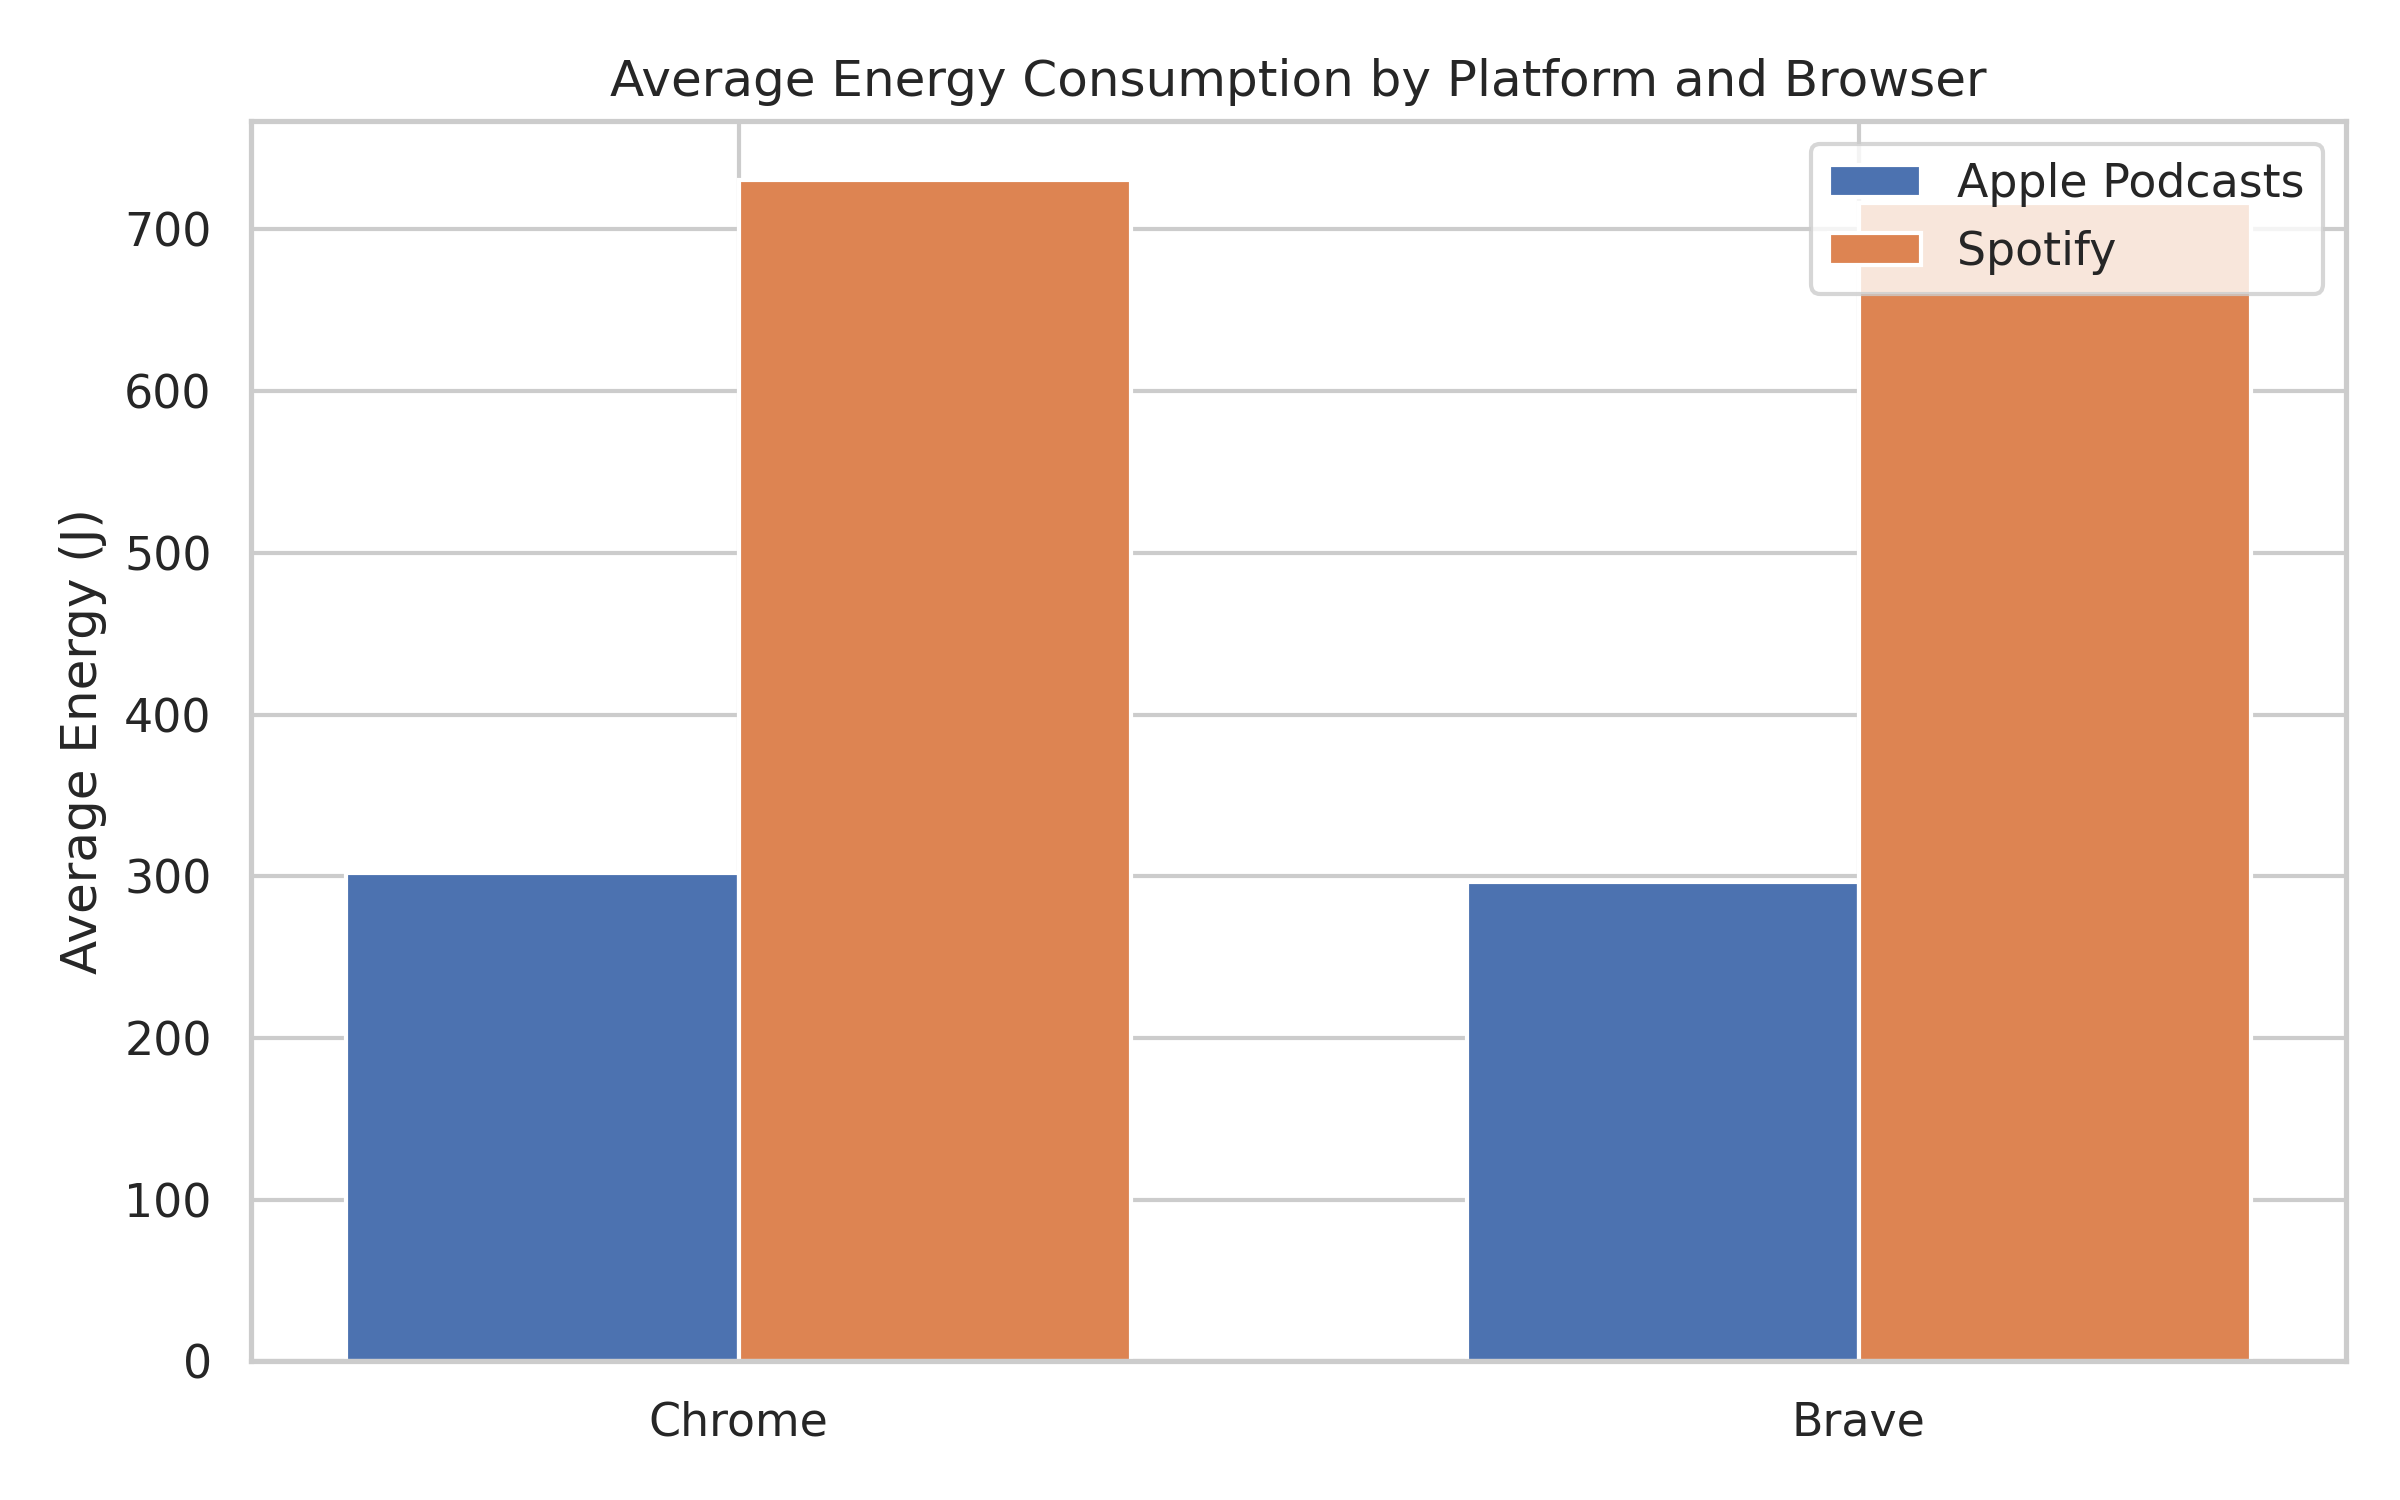
Figure 4: Average energy consumption across platforms and browsers
Across both browsers and playback speeds:
- Apple Podcasts consumes roughly 300 J
- Spotify consumes roughly 720–730 J
This means Spotify uses more than double the CPU energy of Apple Podcasts. Importantly, this pattern holds regardless of playback speed.
This leads to a key insight:
- The choice of streaming platform has a much larger impact on energy consumption than playback speed.
3.4 Why We Can Trust These Results
All configurations were tested 30 times to ensure stable and reliable measurements. Normality was assessed using the Shapiro–Wilk test. For normally distributed data, we applied Welch’s t-test, and for non-normal data, we used the Mann–Whitney U test. Effect sizes (Cohen’s d and CLES where appropriate) were also calculated to evaluate practical significance.
Only one comparison (Chrome - Apple) met the statistical significance threshold (α = 0.05), with a large effect size. All other comparisons showed either no statistical significance or negligible practical differences.
Full statistical tables, p-values, normality results, and effect size calculations are provided in the Appendix. These statistical findings provide the foundation for the interpretation presented in the following discussion.
4. Discussion
4.1 What actually drove energy consumption?
The most prominent finding of this study is the magnitude of the difference between platforms. Across all configurations, Spotify consistently consumed substantially more energy than Apple Podcasts, with mean values of approximately 716–732 J per trial compared to 296–304 J for Apple Podcasts. This represents more than a twofold difference in device-level CPU energy consumption under identical playback conditions.
The consistency of this gap across browsers and playback speeds suggests that it reflects underlying architectural differences rather than incidental measurement variability. Spotify operates as a unified multimedia streaming platform supporting music, podcasts, personalised recommendations, advertising frameworks, analytics services, and, more recently, video content. Public announcements indicate increasing integration of video into the Spotify ecosystem, positioning it as a broader content platform rather than an audio-only service [10]. Even when users stream audio-only podcasts, the underlying web application may initialise components related to video handling, recommendation engines, interface animations, telemetry, or background services.
In contrast, the Apple Podcasts web interface appears comparatively streamlined. It is primarily designed for podcast playback and does not integrate music streaming or multimedia features to the same extent. A simpler content pipeline and reduced background processing could plausibly contribute to lower processor activity during playback.
While this study does not directly instrument internal platform processes, the scale and consistency of the energy difference strongly indicate that implementation design plays a dominant role in determining client-side energy consumption.
4.2 Why did browser choice barely matter?
In comparison to platform differences, browser-level variation was minimal. Chrome and Brave produced nearly identical energy profiles under most conditions, with only small numerical differences observed. This outcome is unsurprising given that both browsers are built on the Chromium engine. They share the same rendering architecture, JavaScript engine, and media decoding pipeline.
Although Brave incorporates additional privacy features, these did not translate into measurable differences in CPU energy during controlled playback. The primary computational workload appears to stem from the streaming platform rather than the browser layer itself.
These findings suggest that when two browsers share the same underlying engine, platform implementation is likely to exert a greater influence on energy consumption than browser-specific optimisations.
4.3 Why playback speed had limited impact?
Playback speed did not consistently reduce total energy consumption. While faster playback shortens listening time, it also increases instantaneous computational demand. Audio decoding, buffering, and playback processes must operate at an accelerated rate, potentially raising average processor activity during the measurement window.
The results indicate that these opposing effects largely offset one another. Only one configuration (Chrome - Apple) showed a statistically significant reduction in energy consumption at 2x speed, and even in this case, the absolute difference was modest relative to the platform-level gap observed between Spotify and Apple Podcasts.
This suggests that user-level behavioural adjustments, such as increasing playback speed, may not reliably produce meaningful device-level energy savings.
4.4 Broader Implications
Although the absolute energy values per session may appear small in isolation, podcasts are consumed at significant global scale. Even modest per-session differences can accumulate when multiplied across millions of daily listening sessions.
More importantly, these findings highlight the relevance of client-side energy efficiency within sustainable software engineering. Much of the existing literature on streaming sustainability emphasises network infrastructure and data centres. However, end-user devices collectively represent a distributed and persistent source of energy demand.
The results indicate that architectural and implementation choices at the platform level can have measurable effects on device energy consumption. In this context, sustainable software design extends beyond server efficiency and includes consideration of client-side resource usage, background processing, and feature integration.
Overall, the evidence suggests that platform design decisions have a more substantial influence on device-level energy consumption than user-controlled playback speed adjustments.
5. Limitations and Issues
This study was conducted on a single laptop running a fixed operating system configuration. While this improved experimental consistency, it limits generalisability to other hardware architectures, particularly ARM-based systems, mobile devices, or alternative operating systems.
Energy measurements were based on CPU package-level counters and did not isolate GPU, memory, or network contributions. As media streaming engages multiple subsystems, total device energy may differ from CPU measurements alone.
The measurement window (90 seconds) may not fully capture longer-term adaptive behaviour such as buffering adjustments or dynamic bitrate changes. The experiment also focused exclusively on web-based playback. Native desktop or mobile applications may employ different media pipelines, hardware acceleration strategies, or background processes, which could alter energy characteristics.
Finally, despite careful control of variables, minor variability may still arise from operating system scheduling behaviour, background processes, thermal conditions, and adaptive streaming dynamics. Although repetition reduced random noise, such factors cannot be entirely eliminated.
6. Conclusion
This study examined how playback speed influences device-level energy consumption during desktop-based web podcast streaming. Across 240 experimental runs, playback speed did not consistently reduce energy use. Only one browser–platform combination showed a statistically significant difference.
Platform choice had a substantially larger impact on energy consumption than playback speed. The findings suggest that improvements in platform design are likely to have a greater effect on energy efficiency than changes in listening behaviour.
7. Future Work
Future work could compare web-based players with native applications, extend experiments to mobile devices, and include additional playback speeds such as 1.5x. Measuring GPU and memory energy separately would provide a more complete system-level view. Further studies could examine offline playback, video podcasts, and other operating systems to improve generalisability.
Replication Package
For researchers interested in replicating this study, the complete replication package is available at our GitHub repository.
References
[1] Podcast Statistics. n.d. 33 Podcast Statistics 2026 (Number of Podcasts & Viewership). Retrieved February 23, 2026 from https://podcastatistics.com/
[2] A. Harris. 2016. Lots of Us Listen to Podcasts Faster Than “Normal.” Join Us! Slate. October 6, 2016. Retrieved February 23, 2026 from https://www.slate.com/blogs/normal/2016/10/06/speed_listening_to_podcasts_is_totally_normal_and_practical.html
[3] K. Notopoulos. 2024. The Best Speed for Podcasts Is 1.2X. Trust Me. Business Insider. January 5, 2024. Retrieved February 23, 2026 from https://www.businessinsider.com/best-speed-podcasts-audiobooks-how-to-listen-2024-1
[4] S. Afzal, N. Mehran, Z. A. Ourimi, F. Tashtarian, H. Amirpour, R. Prodan, and C. Timmerer. 2024. A survey on energy consumption and environmental impact of video streaming. arXiv preprint arXiv:2401.09854. Retrieved February 23, 2026 from https://arxiv.org/abs/2401.09854
[5] M. Harutyunyan. 2026. Must-Know Podcast Statistics in 2026. Loopex Digital. January 30, 2026. Retrieved February 23, 2026 from https://www.loopexdigital.com/blog/podcast-statistics
[6] Teleprompter.com Team. 2025. Podcast Statistics 2025: Global Listener Growth and Trends. Teleprompter.com. November 28, 2025. Retrieved February 23, 2026 from https://www.teleprompter.com/blog/podcast-statistics
[7] StatCounter. n.d. Browser market share worldwide (desktop). Retrieved February 23, 2026 from https://gs.statcounter.com/browser-market-share/desktop/worldwide
[8] T. Durieux. n.d. EnergiBridge. GitHub repository. Retrieved February 23, 2026 from https://github.com/tdurieux/energibridge
[9] Microsoft. n.d. Playwright. Retrieved February 23, 2026 from https://playwright.dev/
[10] Podnews. 2025. Spotify’s rising carbon footprint from turning audio into video. Press release, 20 June 2025. Retrieved February 26, 2026 from https://podnews.net/press-release/spotify-video-environment
[11] Statistics How To. n.d. Cohen’s d: Definition, formula and examples. Retrieved February 23, 2026 from https://www.statisticshowto.com/probability-and-statistics/statistics-definitions/cohens-d/
Appendix
Appendix A - Experimental Setup & Data Cleaning
Measurement Overview
Each configuration was run 30 times, resulting in a total of 240 measurements across all configs. Energy values were computed using the CPU_ENERGY counter retrieved from EnergiBridge.
Outlier Removal
Outlier detection was done using the three-standard-deviation rule (|x − x̄| > 3s).
A total of 1 run was identified as a statistical outlier and removed from further analysis. The remaining data were used for statistical testing. This outlier was removed from the Brave-Apple-1x configuration.
Appendix B - Descriptive Statistics
Full Descriptive Table
| Configuration | # samples | Mean (J) | Std (J) | Median (J) |
|---|---|---|---|---|
| Chrome - Apple 1x | 30 | 304.24 | 6.41 | 303.49 |
| Chrome - Apple 2x | 30 | 299.26 | 3.68 | 299.27 |
| Chrome - Spotify 1x | 30 | 728.74 | 8.57 | 728.78 |
| Chrome -Spotify 2x | 30 | 732.30 | 5.17 | 732.90 |
| Brave - Apple 1x | 29 | 296.78 | 3.30 | 296.32 |
| Brave - Apple 2x | 30 | 296.32 | 3.14 | 296.63 |
| Brave - Spotify 1x | 30 | 716.36 | 11.85 | 715.56 |
| Brave - Spotify 2x | 30 | 716.83 | 11.16 | 719.50 |
Table A1: Descriptive statistics for each browser–platform–speed configuration (N, mean, standard deviation, and median energy in Joules).
| Configuration | Avg Energy (J) |
|---|---|
| Chrome - Apple | ~300 J |
| Chrome - Spotify | ~730 J |
| Brave - Apple | ~296 J |
| Brave - Spotify | ~716 J |
Table A2: Average CPU energy consumption across browser and platform combinations, aggregated across playback speeds.
Appendix C - Exploratory Visualisations
Figures A1–A3 provide exploratory visualisations supporting the statistical analysis.
Global Box Plot
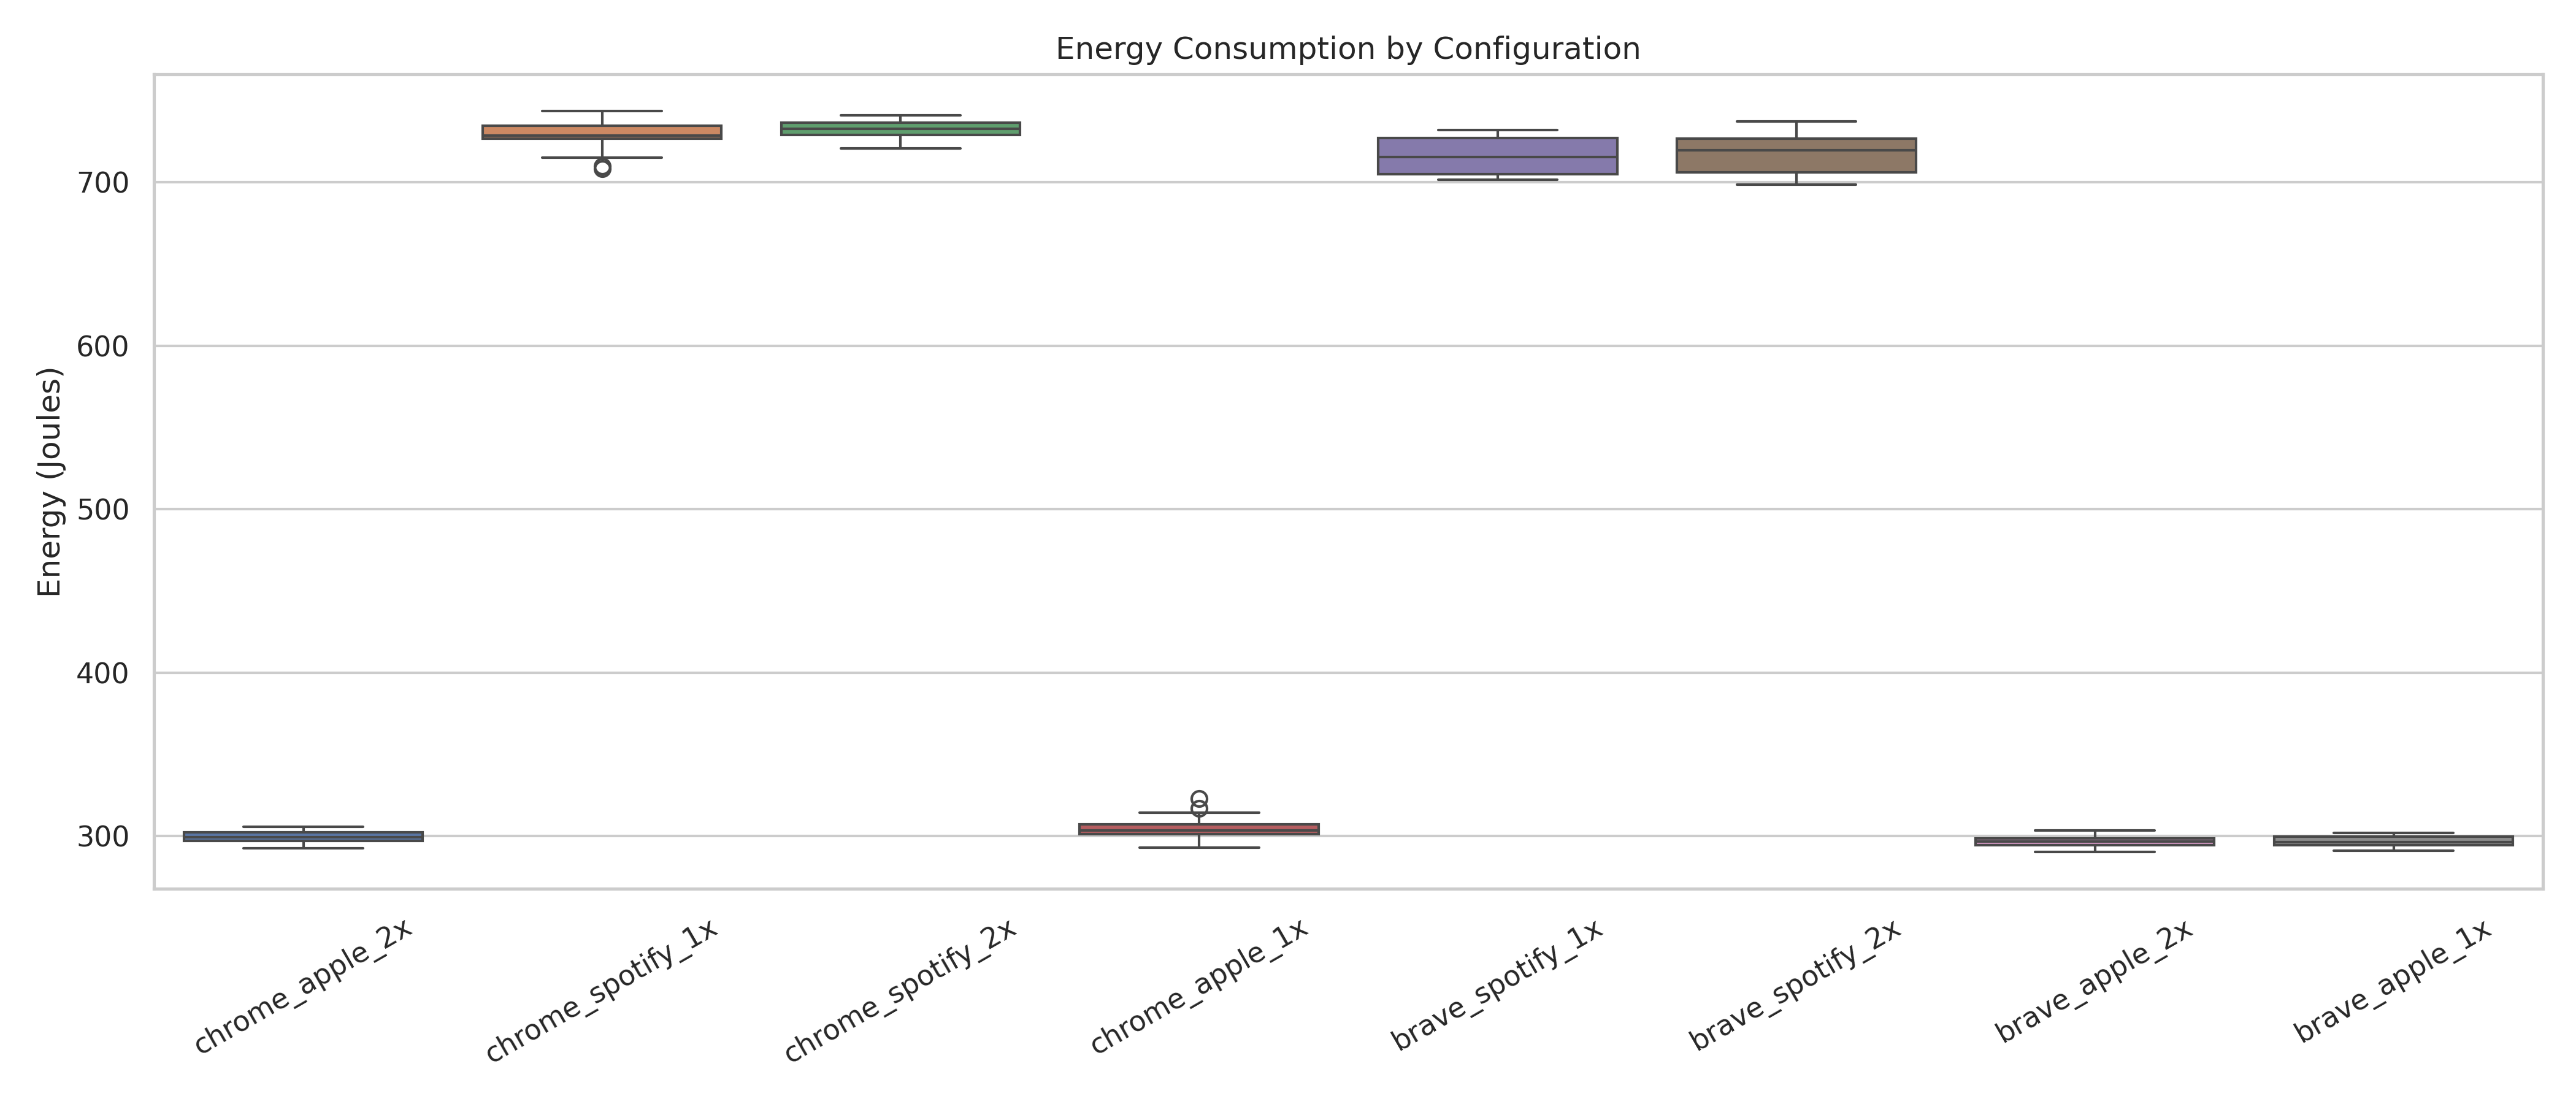 Figure A1: Global boxplot of energy consumption across all configurations, illustrating overall distribution, spread, and outlier
Global Violin Plot
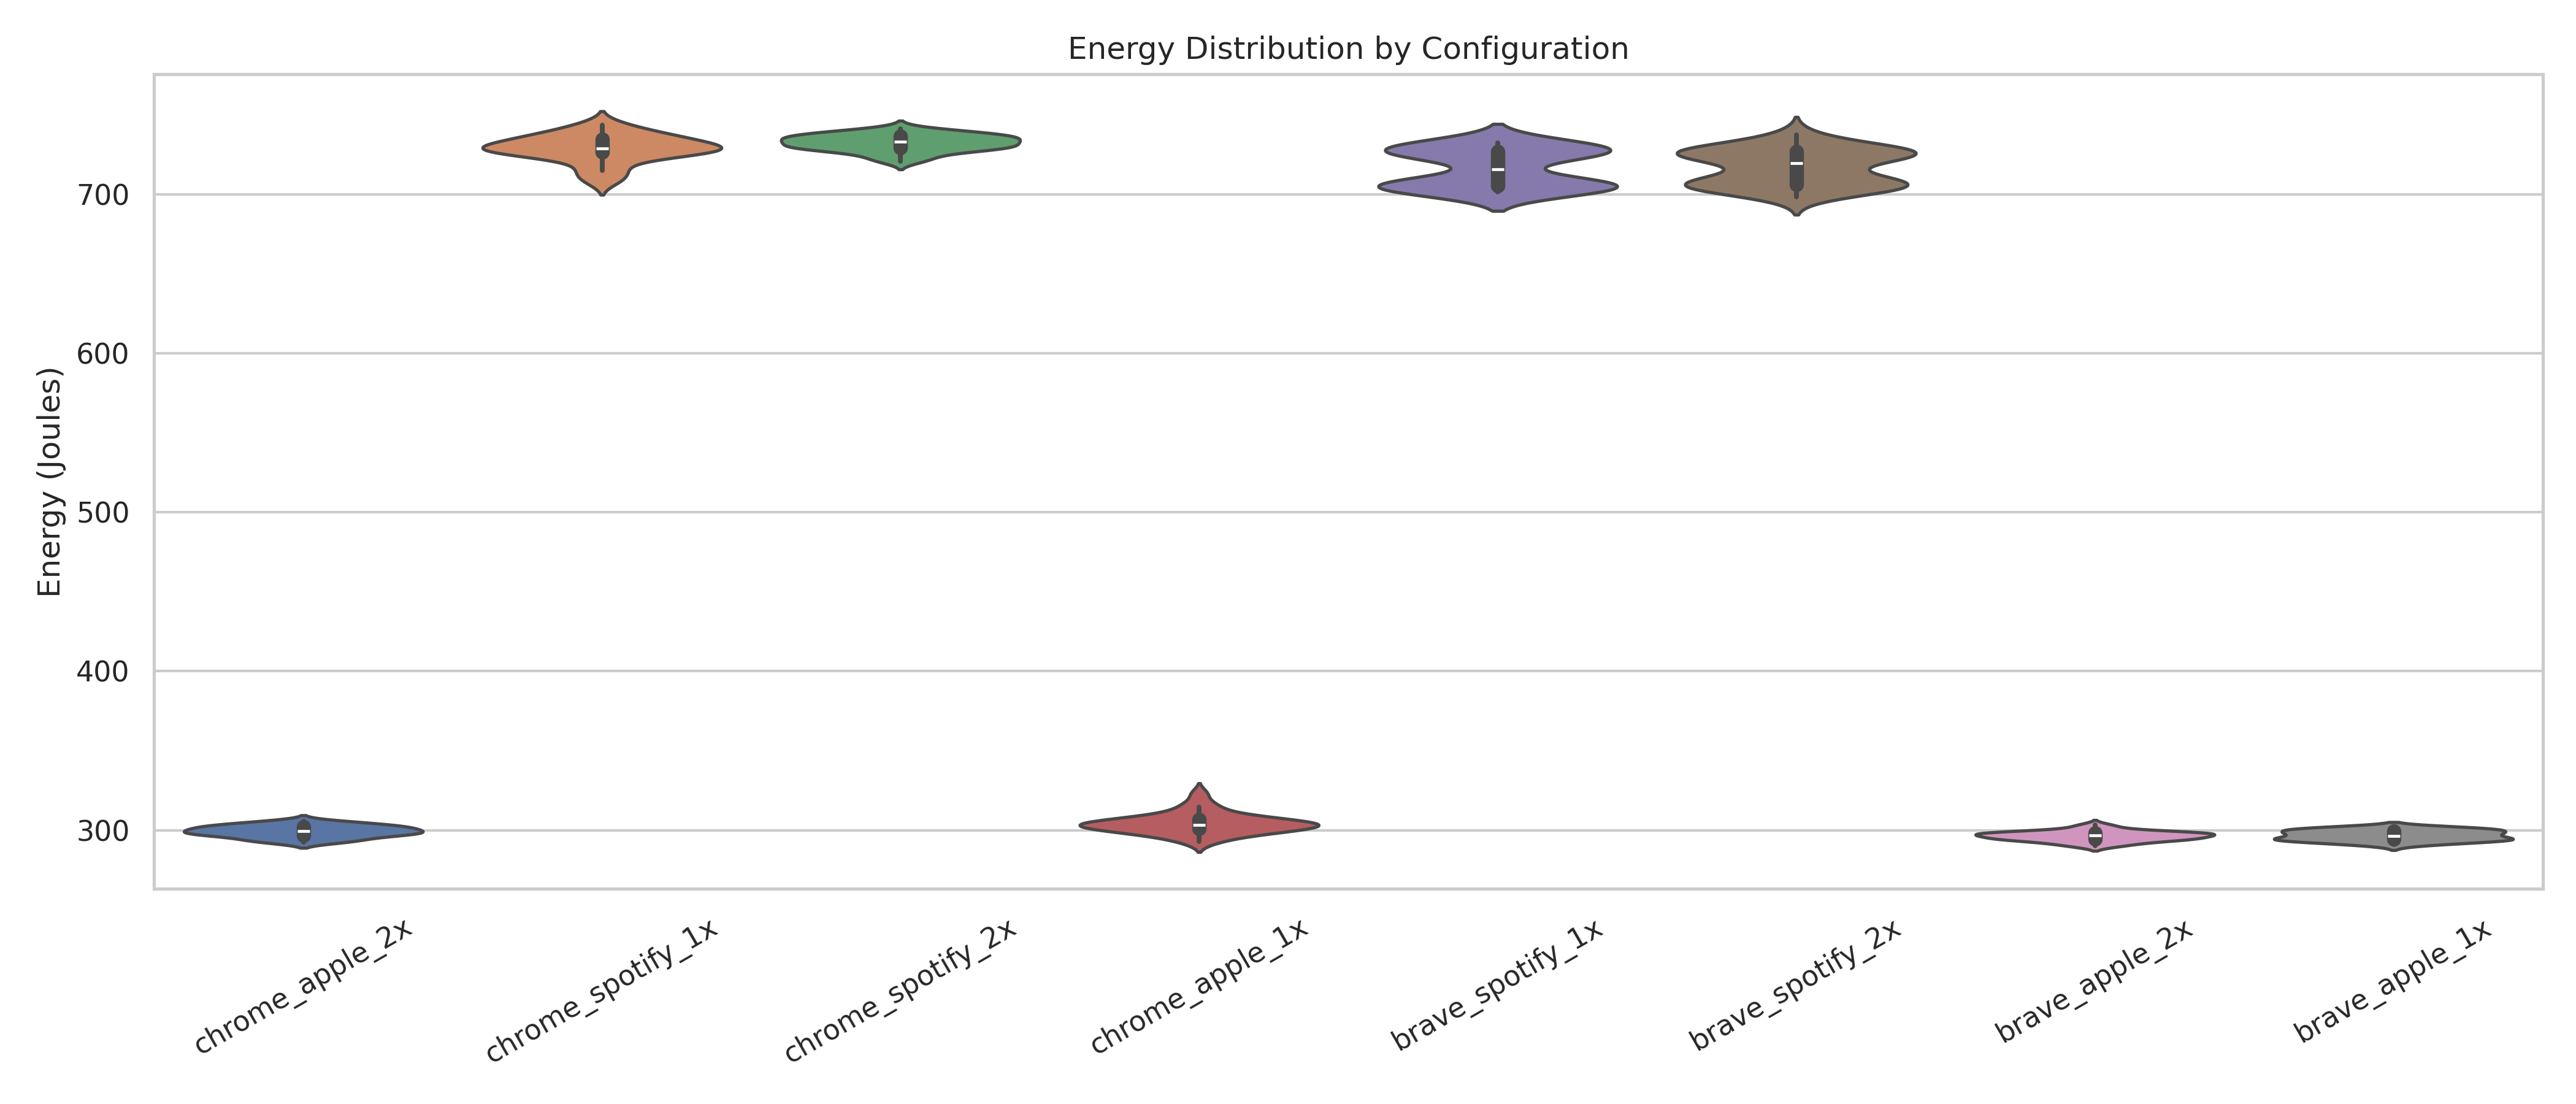 Figure A2: Global violin plot showing the full energy distribution density for each configuration.
Focused 1x vs 2x Plots
 |
 |
 |
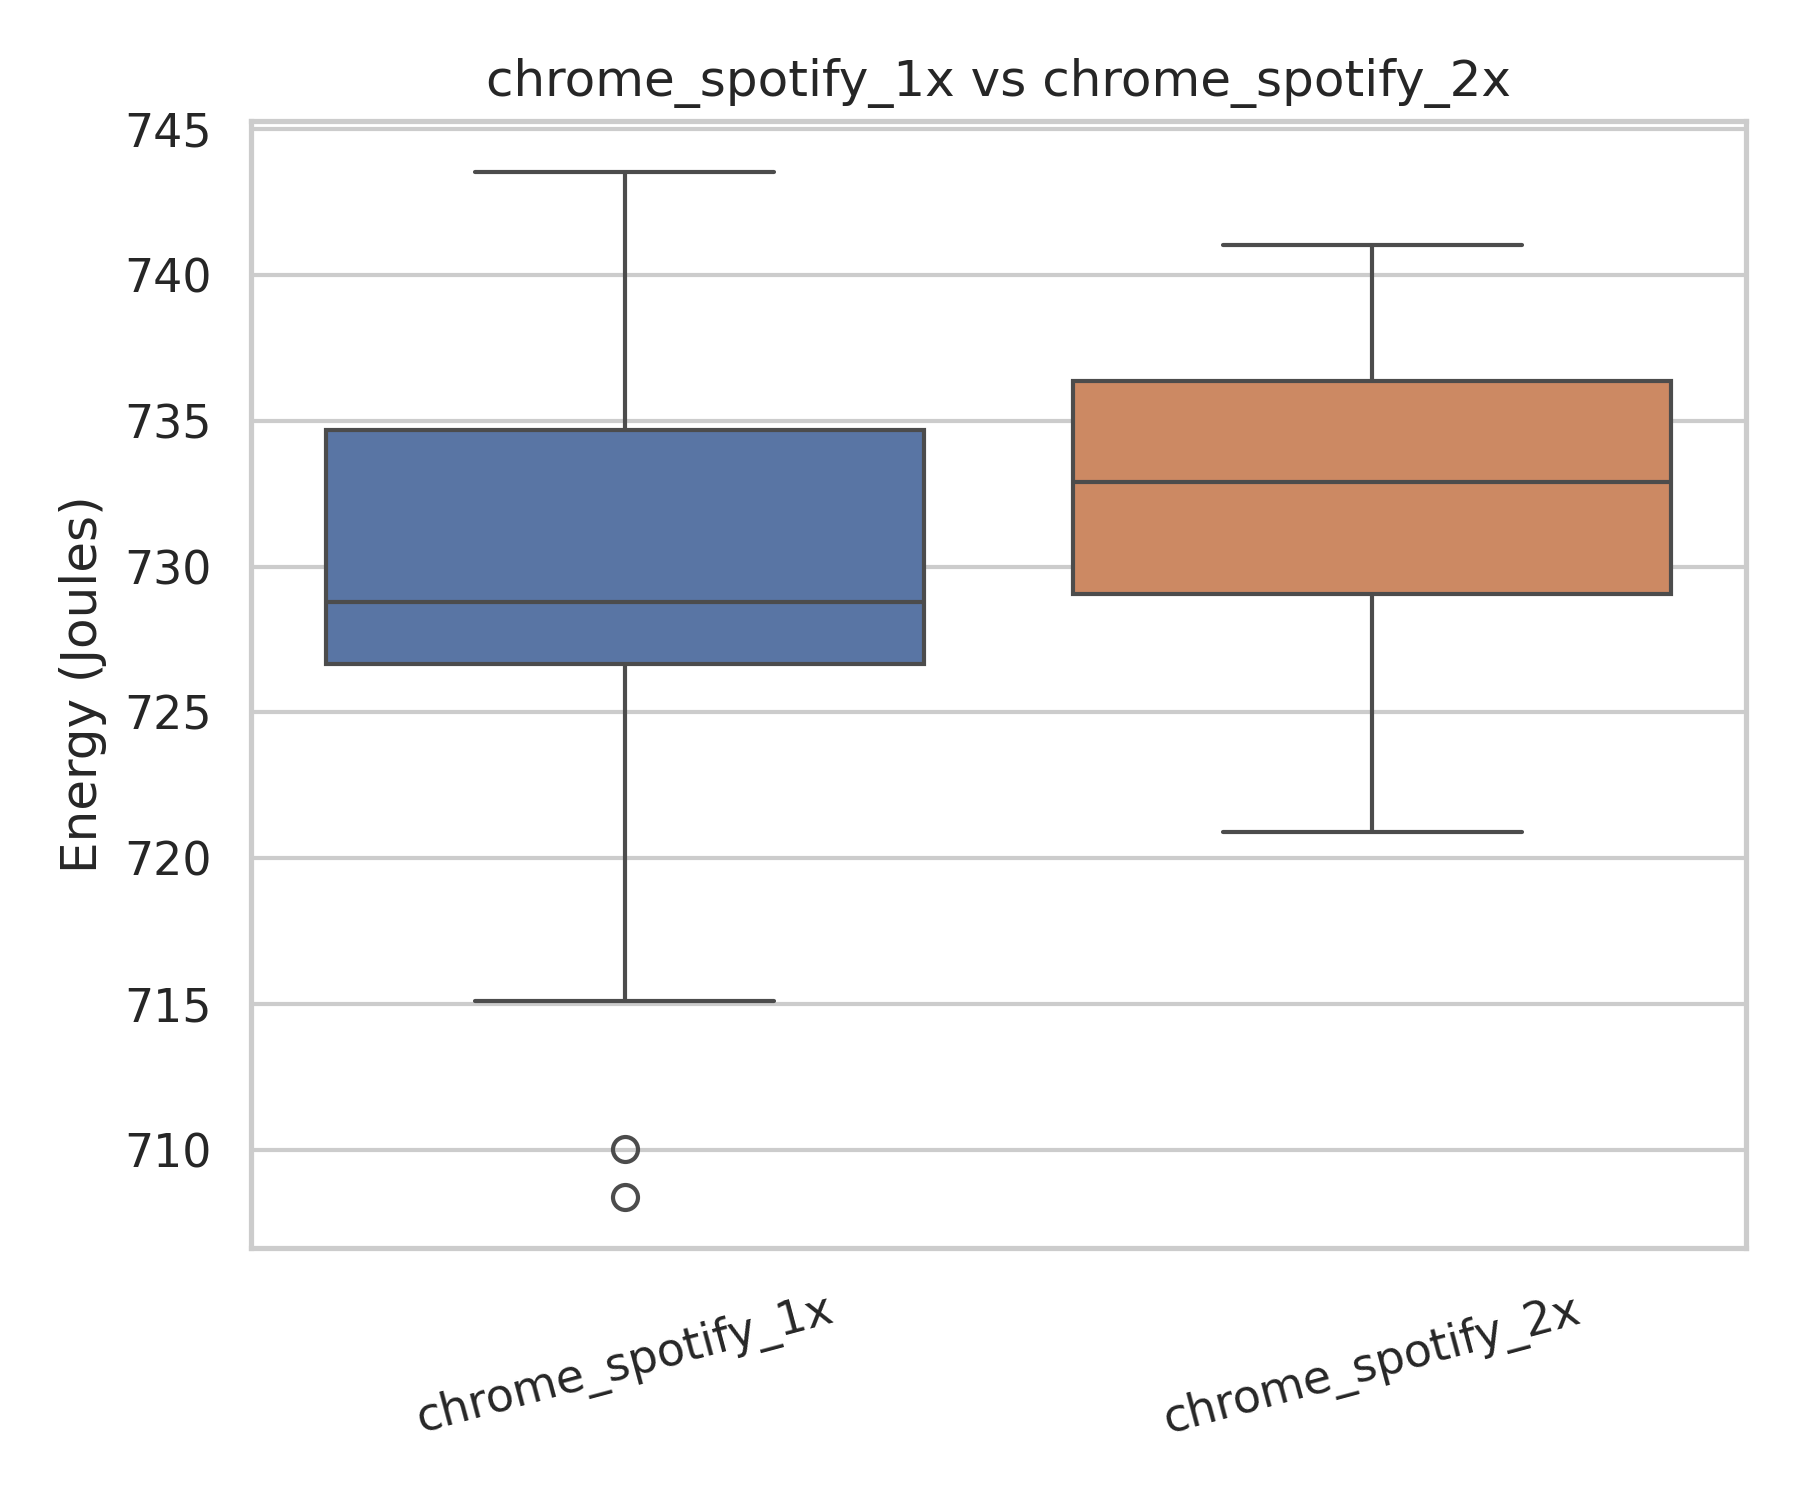 |
Figure A3: Pairwise 1x versus 2x playback boxplots for each browser–platform combination.
Appendix D - Statistical Assumptions & Testing
Normality Testing
The Shapiro-Wilk test was applied to each configuration to assess normality of energy measurements. For configurations where p ≥ 0.05, normality was assumed. For configurations where p < 0.05, data was considered non-normal.
| Configuration | Shapiro p-value | Normal Distribution Assumed |
|---|---|---|
| Chrome - Apple 1x | 0.132789 | Yes |
| Chrome - Apple 2x | 0.532414 | Yes |
| Chrome - Spotify 1x | 0.170301 | Yes |
| Chrome - Spotify 2x | 0.604625 | Yes |
| Brave - Apple 1x | 0.104885 | Yes |
| Brave - Apple 2x | 0.819705 | Yes |
| Brave - Spotify 1x | 0.000055 | No |
| Brave - Spotify 2x | 0.009320 | No |
Table A3: Shapiro-Wilk normality test results for each configuration.
Statistical Significance Testing
To compare 1x and 2x playback within each browser-platform pair, a two-sided Welch’s t-test was performed for configurations satisfying normality (α = 0.05), while the Mann-Whitney U test was applied for non-normally distributed data.
| Comparison | Test Used | p-value | Statistically Significant |
|---|---|---|---|
| Chrome - Spotify (1x vs 2x) | Welch’s t-test | 0.057297 | No |
| Brave - Spotify (1x vs 2x) | Mann-Whitney U | 0.911709 | No |
| Chrome - Apple (1x vs 2x) | Welch’s t-test | 0.000583 | Yes |
| Brave - Apple (1x vs 2x) | Welch’s t-test | 0.585504 | No |
Table A4: Statistical significance testing results comparing 1x and 2x playback within each browser–platform pair (α = 0.05).
Appendix E - Effect Size Analysis
Cohen’s d Interpretation + CLES
Effect sizes were interpreted using standard thresholds for Cohen’s d (small ≥ 0.2, medium ≥ 0.5, large ≥ 0.8) [11] and the Common Language Effect Size interpretation framework.
| Comparison | Effect Size Method | Effect Size Value(s) | Interpretation |
|---|---|---|---|
| Chrome - Spotify (1x vs 2x) | Cohen’s d | d = -0.5030 | Medium |
| Brave - Spotify (1x vs 2x) | Median ΔM + CLES | ΔM = -3.9388 CLES = 0.4911 | ~49.11% probability (no clear dominance) |
| Chrome - Apple (1x vs 2x) | Cohen’s d | d = 0.9537 | Large |
| Brave - Apple (1x vs 2x) | Cohen’s d | d = 0.1429 | Negligible |
Table A5: Effect size results for 1x versus 2x comparisons, including Cohen’s d and Common Language Effect Size (CLES) interpretations.
Back to all projects