The browser energy efficiency revolution
Anyan Huang, Yongcheng Huang, Yiming Chen, Philippe Henry,.
Group 4.
This study investigates the energy consumption of two popular web browsers, Google Chrome and Mozilla Firefox, under realistic user scenarios on macOS, Linux and Windows. By modeling activities such as Reddit browsing and YouTube video playback, and applying baseline-corrected measurements, we provide an empirical comparison of browser efficiency. Our findings reveal that Chrome demonstrates significantly lower energy usage than Firefox for Reddit browsing , suggesting a potential avenue for substantial power savings. In contrast, no statistically significant difference emerges for YouTube playback , indicating that both browsers perform similarly in streaming scenarios. These results highlight the importance of task-specific testing and underscore how browser choice can meaningfully impact environmental footprints, particularly in energy-intensive usage patterns.
Group 4 - The browser energy efficiency revolution: An empirical study of energy consumption from the perspective of user behavior

When 3.7 billion browser users scroll through social media feeds, watch videos, or browse the web, they’re often unaware of the hidden energy consumption differences quietly shaping the digital world’s carbon footprint. These differences might seem small on an individual level, but when scaled across billions of users, they add up to significant environmental impacts.
In this study, we set out to uncover the energy efficiency of everyday web browsing by using an automated testing framework. For the first time, we modeled real user behaviors—like watching YouTube videos and scrolling through Reddit—to measure how much energy popular browsers consume. We compared Firefox 121 and Chrome 122 across three operating systems: MacOS 15.3.1, Fedora, and Windows 11. Using advanced system-level energy isolation techniques, we ensured our measurements were precise and reflective of real-world usage.
Our research aimed to answer critical questions: Is there a meaningful difference in energy efficiency between browsers? How do user behaviors amplify these differences? And can switching browsers or operating systems lead to scalable energy savings? These questions aren’t just technical—they have real-world implications for users, organizations, and the planet
To make these findings actionable, we analyzed user statistics to understand how many people use Firefox across different operating systems. By calculating the potential energy savings of browser migration strategies, we provide practical insights for individuals and organizations looking to reduce their environmental impact.
Our testing methodology focused on two of the most widely used browsers: Google Chrome, known for its speed and feature-rich experience, and Mozilla Firefox, which prioritizes privacy and customization. We used a specialized tool called Energibridge to measure energy consumption during common tasks, ensuring our data was both accurate and relevant to real-world usage.
To capture the full picture, we designed user-centric test scenarios that mimic everyday activities, like streaming videos and browsing content-heavy websites. These scenarios go beyond technical benchmarks, offering practical insights into how small choices—like which browser to use—can have a big impact on energy consumption.
Test Protocol
To accurately measure the energy consumption of browsers during typical user activities, we designed a rigorous test protocol. This protocol ensures consistency across all experiments while capturing real-world usage patterns. Here’s how we conducted our tests:
Baseline Task
Every test began with a 60-second idle period to establish a baseline for energy consumption. This step helped us account for the system’s background energy usage, ensuring that our measurements focused solely on the browser’s activity. The implementation for this task can be found here.
Iterations
Each test case was repeated 30 times to ensure statistical significance. Every iteration lasted 2 minutes, divided into two phases: 60 seconds of active browsing or video playback, followed by 60 seconds of idle time. This structure allowed us to measure both the energy consumed during active use and the system’s return to baseline during idle periods. The implementation for the iteration script is available here.
Test Cases
We focused on two common user activities to evaluate browser energy efficiency: video streaming and social media browsing
- Video Streaming (YouTube): To measure energy usage during video playback, we automated the process of playing a YouTube video using Python and Selenium. The script navigates to a specific video, clicks the play button, and monitors energy consumption for 60 seconds. Below our implementation:
  def play_youtube_video(duration_seconds=60):
      driver = webdriver.Firefox()  # Ensure geckodriver is in PATH

      try:
          driver.get("https://www.youtube.com/watch?v=dQw4w9WgXcQ")
          wait = WebDriverWait(driver, 5)
          try:
              accept_all_button = wait.until(EC.element_to_be_clickable((By.XPATH, "//button[.//span[contains(text(), 'Accept all')]]")))
              accept_all_button.click()
              time.sleep(5)
          except TimeoutException:
              print("Accept all not found")
          try:
              play_button = wait.until(EC.element_to_be_clickable((By.XPATH, "//button[contains(@class, 'ytp-large-play-button')]")))
              play_button.click()
              print("Clicked Play button.")
          except:
              print("Play button not found or already playing.")
          time.sleep(duration_seconds)

      finally:
          driver.quit()
- Social Media Browsing (Reddit): To assess energy consumption during social media use, we automated scrolling through Reddit. The script loads the Reddit homepage, waits for the page to load, and then simulates user scrolling for 60 seconds. Below our implementation:
    def browse_reddit(duration_seconds=60):
    driver = webdriver.Firefox()  # geckodriver is assumed to be in PATH

    try:
        driver.get("https://www.reddit.com")

        time.sleep(5)  # Initial wait

        start_time = time.time()
        while time.time() - start_time < duration_seconds:
            driver.execute_script("window.scrollTo(0, document.body.scrollHeight);")
            time.sleep(2)  # Wait briefly between scrolls

    finally:
        driver.quit()
Testing Configuration
Software Versions
We used the latest stable versions of the browsers and tools at the time of testing. Google Chrome was tested on version 133.0.6943.99, while Mozilla Firefox was evaluated on version 135.0. For energy measurement, we relied on Energibridge v0.0.7, a specialized tool that captures detailed energy consumption data during browser tasks.
Test Environment
Our experiments spanned three operating systems—Linux, MacOS, and Windows—to capture a comprehensive picture of energy efficiency across platforms.
On Linux, we used an ASUS Zenbook 14 UX3405MA equipped with an Intel® Core™ Ultra 9 185H processor and 32 GB of RAM. The system ran Fedora Linux 41 (Workstation Edition) with Linux kernel version 6.12.15-200.fc41.x86_64 and the Wayland windowing system.
For MacOS, we tested on a Macbook Air M3 verion, equipped with Apple M3 chip and 16 GB of RAM. The system ran MacOS Sequoia 15.3.1.
On Windows, we used a high-performance personal PC featuring an Intel® Core™ i9-12900K processor and 32 GB of RAM. The system ran Windows 11 Professional, version 23H2 (Build 22631.4890).
Experimental Controls
To ensure consistency across tests, we implemented strict controls to minimize system interference and variability.
First, we activated Zen Mode, a set of practices designed to reduce background activity. This involved closing all non-essential applications, disabling notifications, and disconnecting unnecessary peripherals like USB drives and external displays. We also stopped background services such as web servers and file-sharing tools. Network connectivity was carefully managed, with wired connections preferred over wireless for stability.
Next, we employed Configuration Freezing to lock key settings and eliminate variability. Display brightness and resolution were fixed at consistent values, and automatic brightness adjustment was disabled. Power management features, including dynamic power-saving modes, were turned off to prevent fluctuations in energy usage. Network conditions were stabilized to ensure consistent performance during tests.
By enforcing these rigorous controls, we minimized external factors that could skew our results. This approach not only ensures the accuracy of our findings but also makes it possible for others to reproduce our experiments under the same conditions.
Statistical Significance Testing Formulas
T-Statistic
The T-Statistic measures the significance of the difference between the means of two samples. It is calculated as:
\[t = \frac{\bar{X}_1 - \bar{X}_2}{\sqrt{\frac{s_1^2}{n_1} + \frac{s_2^2}{n_2}}}\]where:
- $\bar{X}_1$, $\bar{X}_2$ are the means of the two samples,
- $s_1^2$, $s_2^2$ are the variances of the two samples,
- $n_1$, $n_2$ are the sizes of the two samples.
P-Value
The P-Value represents the probability of observing the current or a more extreme test statistic under the null hypothesis. For a two-sample t-test, it is given by:
\[p = 2 \cdot \text{CDF}_t(-|t|; \text{df})\]where:
- $\text{CDF}_t$ is the cumulative distribution function of the t-distribution,
-
$ t $ is the absolute value of the t-statistic, - $\text{df}$ is the degrees of freedom, calculated as:
Significance Criterion
- If $p < \alpha$ (typically $\alpha = 0.05$), reject the null hypothesis, indicating a significant difference between the two sample means.
- If $p \geq \alpha$, there is insufficient evidence to reject the null hypothesis.
Testing Results
MacOS
This section summarizes the macOS test outcomes for Chrome and Firefox under two common usage scenarios: Reddit browsing and YouTube video playback. All values have been baseline-corrected using an average sleep energy measurement of 240.68 Joules, following outlier removal.
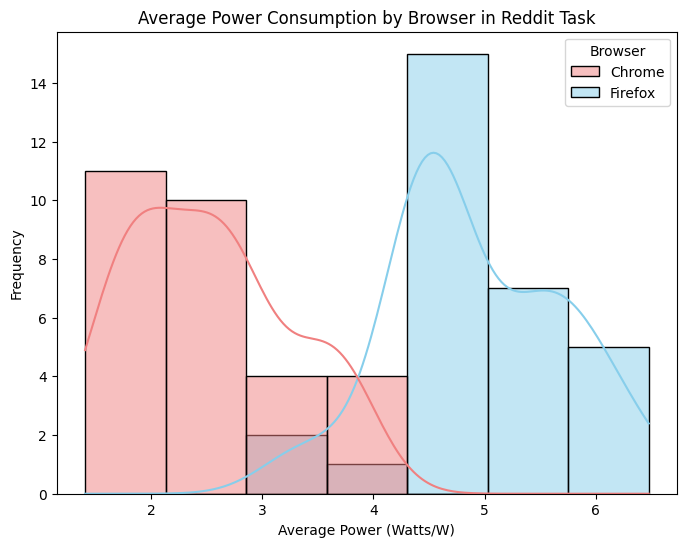
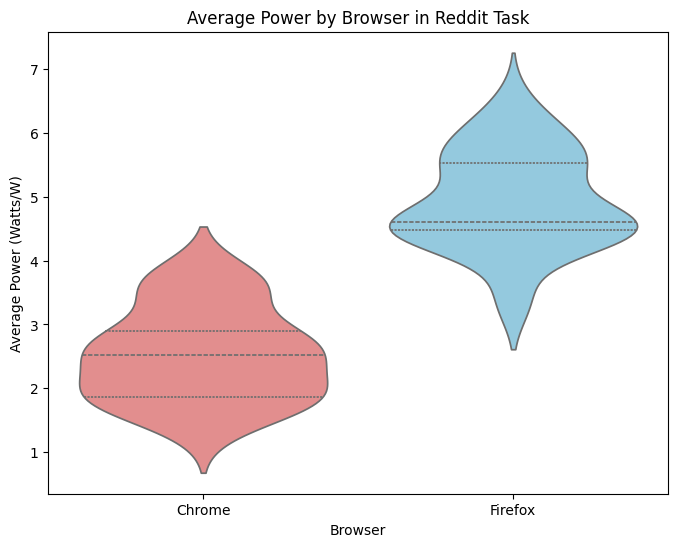
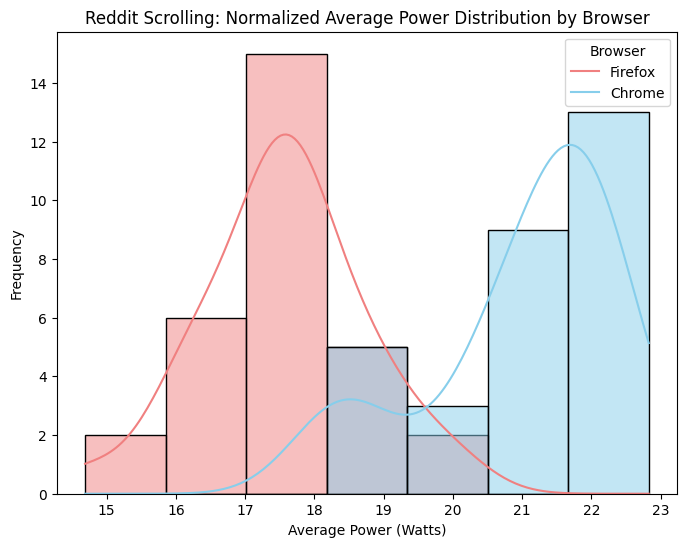
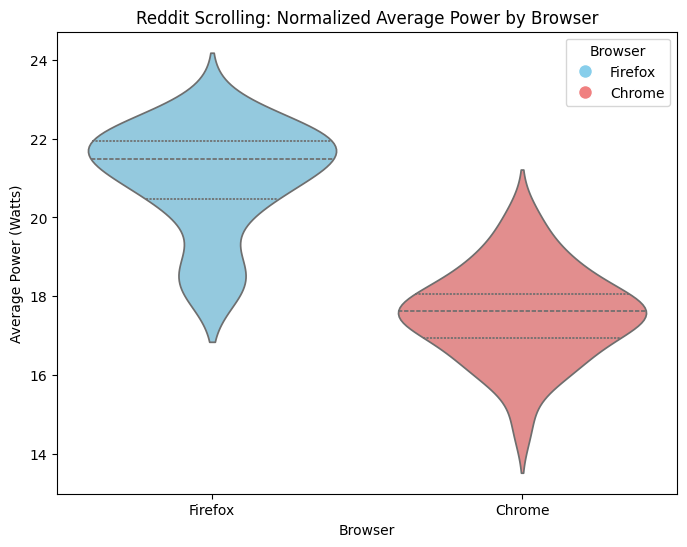
Reddit Browsing Task
After cleaning and analyzing the data, we found that the baseline average energy consumption (post-outlier removal) was 240.68 Joules. During the data cleaning process, one negative outlier (Iteration 59: -0.065 Joules) was excluded. The statistical analysis revealed a t-statistic of 12.43 and a p-value of 7.20e-18. The t-statistic indicates a significant difference in energy consumption between the two browsers, and the p-value is extremely small, far below the standard significance threshold of 0.05. This suggests that the observed difference is highly unlikely to be due to random variation, providing strong evidence of a statistically significant difference. As shown in the figures, Chrome demonstrates significantly lower average energy consumption than Firefox for the Reddit browsing task.
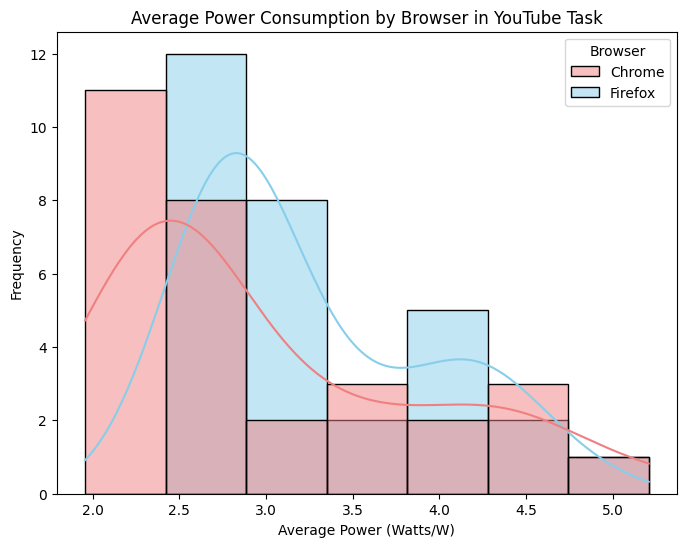
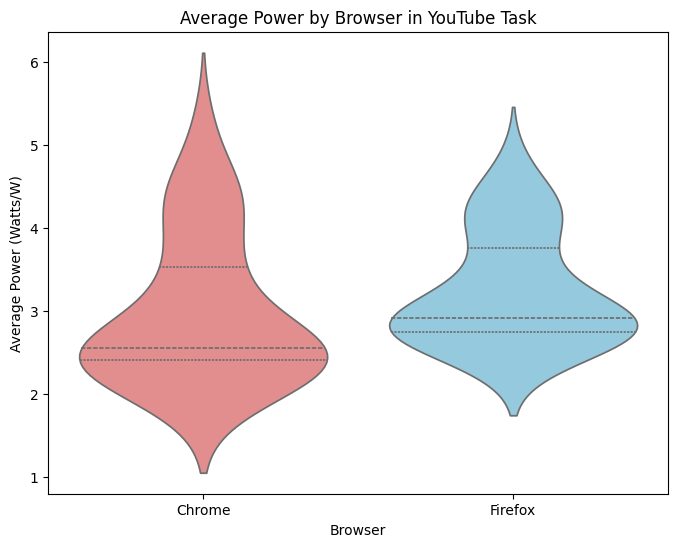
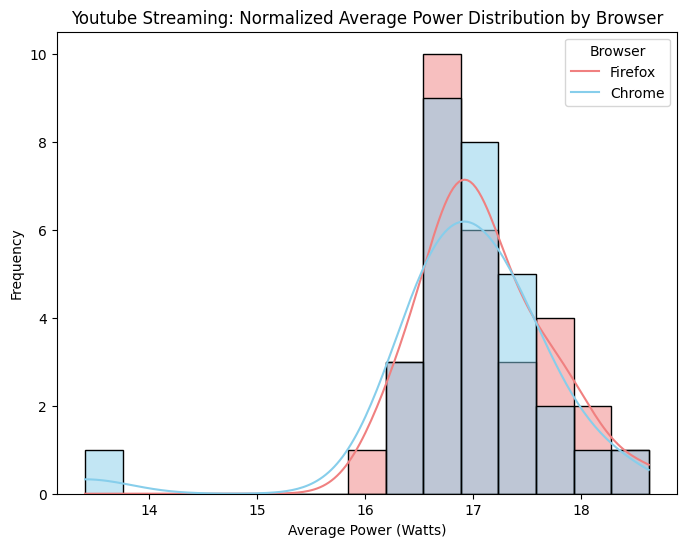
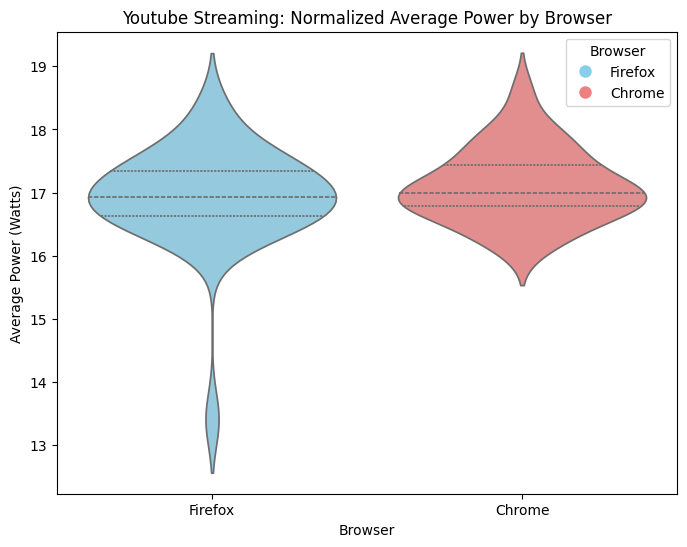
YouTube Playback Task
After cleaning and analyzing the data, we found that the baseline average energy consumption (post-outlier removal) was 240.68 Joules. No negative outliers were detected during the data cleaning process. The statistical analysis revealed a t-statistic of 1.26 and a p-value of 0.211. The p-value is above the standard significance threshold of 0.05, suggesting that there is no statistically significant difference between the energy consumption of Chrome and Firefox for YouTube playback. As shown in the figures, the average energy consumption of both browsers is quite similar, making it difficult to conclude which one is more efficient in this scenario.
Windows
This section summarizes the Windows test outcomes for Chrome and Firefox under two common usage scenarios: Reddit browsing and YouTube video playback. All values have been baseline-corrected using an average sleep energy measurement of 455.0382 Joules, following outlier removal.
Reddit Browsing Task
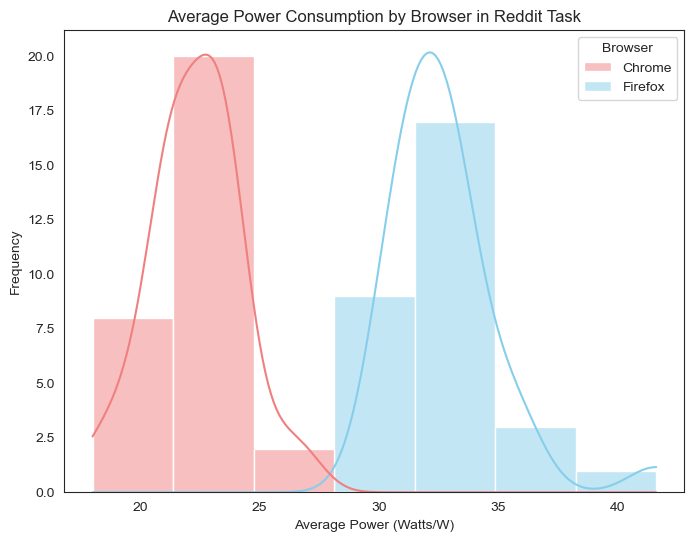
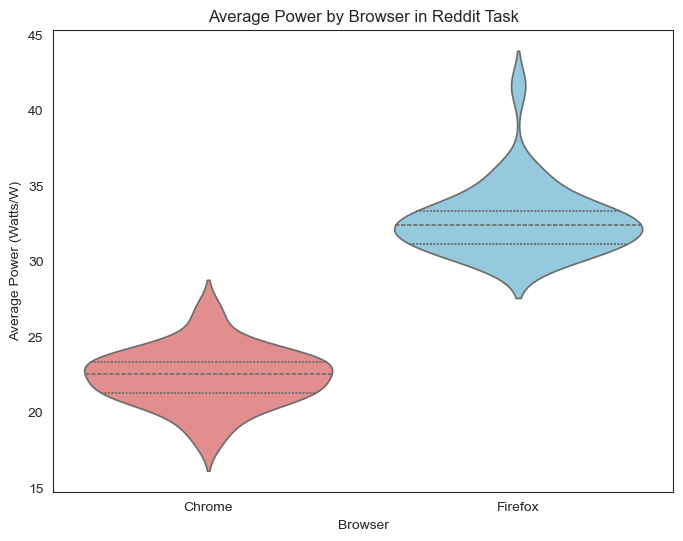
Interpretation: As shown in Figures, Chrome demonstrates a statistically significant lower energy consumption for Reddit browsing compared to Firefox. The p-value (7.80e-27) confirms that this difference is highly significant and unlikely due to random chance.
From a sustainability perspective, this means that using Chrome for Reddit browsing could result in measurable energy savings, reducing power consumption and contributing to a lower environmental footprint. Over time, this could lead to more efficient resource use and lower electricity costs for users.
YouTube Playback Task
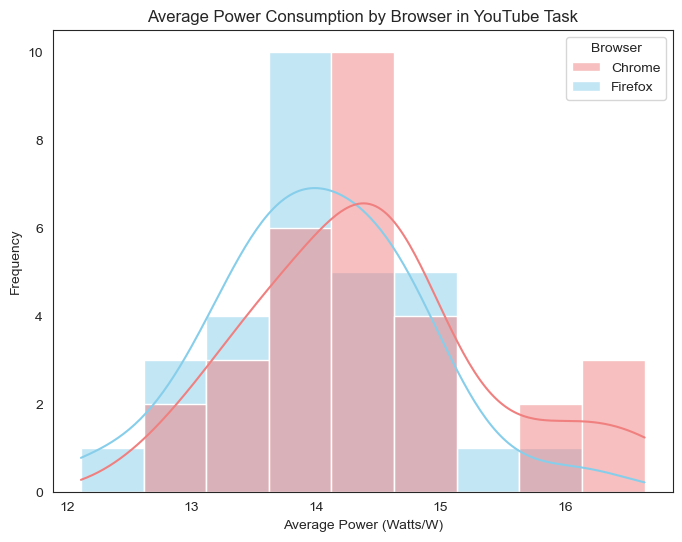
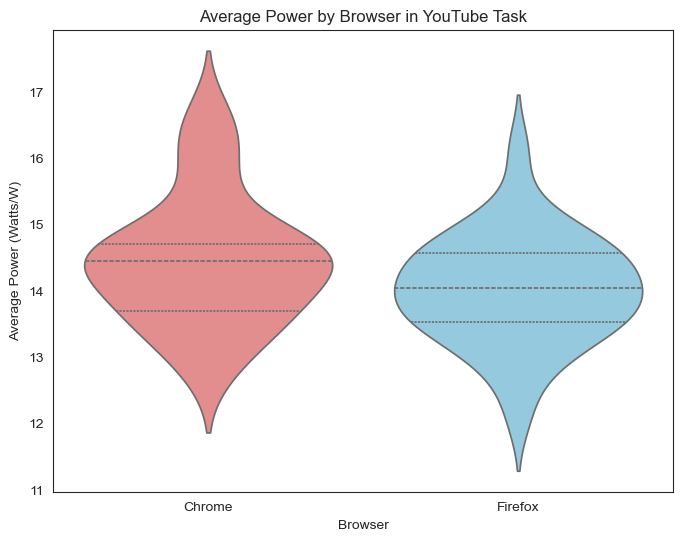
Interpretation: In Figures, the YouTube playback energy usage for Chrome and Firefox appears more similar. The p-value (0.0652) suggests that the difference in average energy consumption is not statistically significant at the 0.05 threshold, although it is marginally close.
This indicates that for YouTube playback, both browsers perform similarly in terms of energy consumption, meaning there is no clear advantage in choosing one over the other purely for energy efficiency purposes.
Linux
This section summarizes the Linux test outcomes for Chrome and Firefox under two common usage scenarios: Reddit browsing and YouTube video playback. All values have been baseline-corrected using an average sleep energy measurement of 502.46 Joules, following outlier removal.
Reddit Browsing Task
After cleaning and analyzing the data, we found that the baseline average energy consumption (post-outlier removal) was 502.46 Joules. The statistical analysis revealed a t-statistic of 10.77 and a p-value of 1.81e-15. The t-statistic indicates a substantial gap in efficiency. On the other hand, the p-value is very small, far below the standard significance threshold of 0.05. This means the probability of observing such a difference by random chance is almost zero. As shown in Figures 5 and evidenced with the averages shown in Table 1, Chrome (17.533 W) demonstrates a statistically significant lower energy consumption for Reddit browsing compared to Firefox (21.013 W).
YouTube Playback Task
The statistical analysis revealed a t-statistic of -0.96 and a p-value of 0.336. On one hand the p-value is too large, indicating that the differences may be due to random variation. Along side this, the t-statistic is very small (negative!), indicating no real difference between average power consumptions. Unlike the results for reddit browsing, there seems to be no statistically significant difference between both browsers. This is further evidenced by nearly identical mean power averages as seen in Table 2
Results Table
Table 1: Reddit Scrolling
Average Normalised Power in Watts
| Linux | Windows | MacOS | |
|---|---|---|---|
| Firefox | 21.013 | 32.369 | 5.113 |
| Chrome | 17.553 | 22.514 | 2.353 |
Table 2: Youtube Streaming
Average Normalised Power in Watts
| Linux | Windows | MacOS | |
|---|---|---|---|
| Firefox | 16.928 | 14.443 | 3.503 |
| Chrome | 17.108 | 14.039 | 3.736 |
Table 3: Operating System Usage Worldwide (Desktop)
Percentage of market share, based on statcounter
| Linux | Windows | MacOS |
|---|---|---|
| 3.72% | 71.9% | 15.02% |
Table 4: Browser Usage Worldwide (Desktop)
Percentage of maket share, based on statcounter
| Firefox | Chrome |
|---|---|
| 6.26% | 65.77% |
Conclusion
Browsers
When comparing the average power consumption of Firefox and Chrome during scrolling tasks, Firefox appears to be less efficient, consuming around 4 Watts more than Chrome (for the most extreme case). This difference has significant implications at scale. Assuming 1 billion daily users spend an average of 143 minutes scrolling through social media, Firefox users would consume approximately 572 additional Watts per person compared to Chrome users. With an estimated 62.6 million (based on table 4) Firefox desktop users, this results in an extra 35,807 kilowatts of energy consumed daily. This highlights the importance of optimizing browser efficiency to reduce energy consumption globally, also leading us to recommend the usage of Chrome for daily browsing.
Operating Systems
When comparing power consumption across operating systems, Windows stands out as the least efficient, reaching an average of 32.37 Watts during browsing tasks. Linux follows with a maximum of 21 Watts, while MacOS is the most efficient at just 5 Watts. These differences become significant when scaled globally. With 719 million Windows users compared to 3.72 million Linux users (table 4) (again assuming 1 Billion users), the 715 million additional Windows users consume approximately 11 Watts more per minute than Linux users. Over an average daily social media usage of 143 minutes, this results in 2,971 additional Watts per person. At scale, this leads to an excess of 2.12 million kilowatts per day due to Windows’ higher energy consumption during browsing. This is only for windows, the difference is larger with MacOS, with a similar calculation leading to 2.19 million kilowatts extra being consumed by Windows users than MacOS users, this is similar to the amount of energy a Nuclear Power plant produces. This leads us to recommend, above anything else, not to utilize windows systems.
Limitations
Despite the valuable insights derived from our user-centric energy consumption measurements, this study has certain limitations. We only tested two browsers, Chrome and Firefox, in specific versions, leaving other browsers like Safari, Edge, or older releases unexamined. Our usage scenarios—YouTube playback and Reddit browsing—represent only a fraction of real-world browsing behaviors, which can include gaming, multi-tab usage, and complex web applications. Additionally, the hardware environments for Linux, macOS, and Windows were restricted to specific devices, limiting the broader applicability of our findings. Network conditions, which we attempted to standardize, may also vary greatly in practice and influence energy usage. Lastly, although we minimized background processes, real-world situations often involve concurrent tasks (e.g., antivirus scans, syncing) not fully represented in our controlled tests.
Future Work
As for future work, expanding the scope of browsers and versions would provide a more comprehensive view of how different rendering engines and optimizations impact energy consumption. More complex user scenarios, including video conferencing, multi-tab workflows, and gaming, could offer richer insights into how browsing choices affect power draw. Longitudinal studies over extended periods would highlight browser performance in routine daily usage, while testing on a wider range of hardware—including older and ARM-based devices—would improve generalizability. Varying network conditions, such as bandwidth and latency, merit further exploration for their potential to affect browser energy efficiency. Finally, continued refinement of automated testing frameworks and tools (like Energibridge) could yield more granular and scalable data, deepening our understanding of how browser behavior influences energy use.
Back to all projects