Comparing Energy Consumption of React Framework Versions
Thijs Nulle, Harmen Kroon, Petter Reijalt.
Javascript Frameworks play a fundamental role in current-day website development. Major releases are rolled out yearly and add new improvements over previous versions. This research shows significant developments in terms of power consumption related to loading large datasets between different versions of the React Framework
Comparing Energy Consumption of React Framework Versions

Introduction
The ICT sector currently accounts for 1.8 to 2.0% of all global emissions. It is predicted that the output of the ICT sector will increase to 830 MT of CO2 emissions in 2030. Because of the ever-expanding ICT sector, it will become more and more important to write code that keeps power consumption to a minimum, to keep in line with the 1.5°C decarbonisation pathway and net-zero targets set by companies and countries worldwide. 1
One of these factors in the CO2 output of the sector is the output of websites. A website with 10.000 page visits per month results on average in an annual CO2 emission of 211kg (a single page visit produces 1.76 grams of CO2).2
Most websites nowadays use some kind of Javascript framework. Providing developers with pre-written and pre-tested code to write easily scalable web applications.3 Currently, only 18.3% of websites do not use any kind of Javascript framework. While these Javascript frameworks make it easier to produce and scale websites, they also introduce a certain kind of extra overhead, which results in extra energy consumption.4
One of the biggest frameworks is React, which is built by Meta and used by 7 per cent of all websites worldwide. These include one of the most-visited websites worldwide. Namely, Apple.com, Linkedin.com, and Amazon.com are some of the most notable names that use React in one way or another on their websites.5
Changes in React can cause huge changes downstream, with millions of websites being affected. One of these changes is power consumption. More efficient code in the React framework can result in drastic cuts in carbon emissions. Research, however, shows that a significant amount of websites run outdated versions of the React Framework. 6 This could be because of a myriad of issues that could arise from upgrading to a newer version. Most notably breaking changes that break backwards compatibility, in which case the developer has to go in and manually change the code.
We researched whether or not over time changes in the React framework have led to more efficient code and thereby less power consumption. We looked at the fact whether or not upgrading to the newest React version can benefit companies, from an environmental point of view.
Methodology
Experiment
To compare the evolution of energy consumption within the React framework, we propose two implementations of the same website, using both a legacy version and a modern version. The website contains a simple, CPU-intensive task in loading a large dataset, rendering the dataset inside a table and performing several operations on the dataset, which we will highlight later. In essence, we compare the energy usage of the framework’s state management and rendering process.
For this article, we used React version 18.2.0 (modern version) versus the last beta release 0.14.0 (legacy version). The main difference between the legacy version and the modern version of React is the style in which one writes components to use within a website; legacy React uses class components, whereas modern React uses functional components. Inherently, these can perform the same operations, but under the hood, they are functionally different and their performance might differ. The largest difference between class- and functional components is regarding the state management, where the legacy version utilises the class-based this.setState functionality, and the modern version utilises the useState hook. Essentially, these two functions have the same outcome but are implemented differently under the hood, and thus also perform differently on energy usage.
As loading a large dataset, and subsequently rendering the data inside a table, is not necessarily an interesting benchmark, we opted to add CPU-intensive tasks to perform on the dataset. The dataset consists of 10k rows consisting of an identifier (integer between 1 and 100), name (random string of 50 characters), age (integer between 1 and 100) and a comma-separated list of hobbies (random selection of 30 hobbies). After each operation we perform, we take the resulting data and store it as a local variable inside the component using the method as advised by the version of the framework. The operations we perform in order are:
- Filter all rows that have an identifier greater than 90
- Filter all rows that do not contain the letter K inside the name
- Filter all rows that have an age less than 21
- Filter all rows that do not contain swimming as a hobby
- Reverse all rows
- Randomise the order of all rows
- Increase the age by 1 for all rows
Each CPU-intensive task is linked to a dedicated button for direct invocation. This minimalist user interface ensures simplicity and isolates table rendering, minimising potential overhead. This approach prioritises accurate energy consumption measurements and enables a focused comparison between the legacy and modern versions of React.
Tools
Our experiment is automated using Python and can be found in our Github repository. Tasks are shuffled such that React versions are tested in random order and alternated with 50 seconds of sleep to mitigate tail energy consumption. The energy consumption is measured using EnergiBridge v0.0.4 at 200 ms intervals.
Before EnergiBridge measurements, the React server is initialised and once the server is up and running the browser-specific webdriver is opened with Selenium. We used the Chrome webdriver in our experiment, which provides a clean environment for interacting with the Chrome browser. During a task, the exact same order of button presses is performed and each EnergiBridge measurement ends once the browser window is terminated automatically.
Hardware set-up
The experiment is performed on a Windows laptop - see table below - running no non-Windows services and warmed up by issuing extra tasks up front. External factors are accounted for by connecting to the internet via ethernet, having the room controlled at room temperature and keeping the laptop plugged into to the power supply at all times.
| Laptop | HP ZBook Studio G3 |
|---|---|
| CPU | Intel Core i7-6700HQ @ 2.6GHz |
| RAM | 8 GB 2133MT/s |
| GPU | Intel HD Graphics 530/NVIDIA Quadro M1000M |
| OS | Windows 10 Home |
| Battery | HP Li-ion 32.057/63.992 mWh |
| Power supply | KFD A190 19.5V 7.7A |
Table 1: Laptop specifications used in our experiment
Results
The results of our experiment can be found on our Github repository. Here two different experiments, can be found. For this section we used the last experiment we ran. Here two folders can be found with 32 iterations of the experiment for both the modern version and the legacy version.
Energy & Power
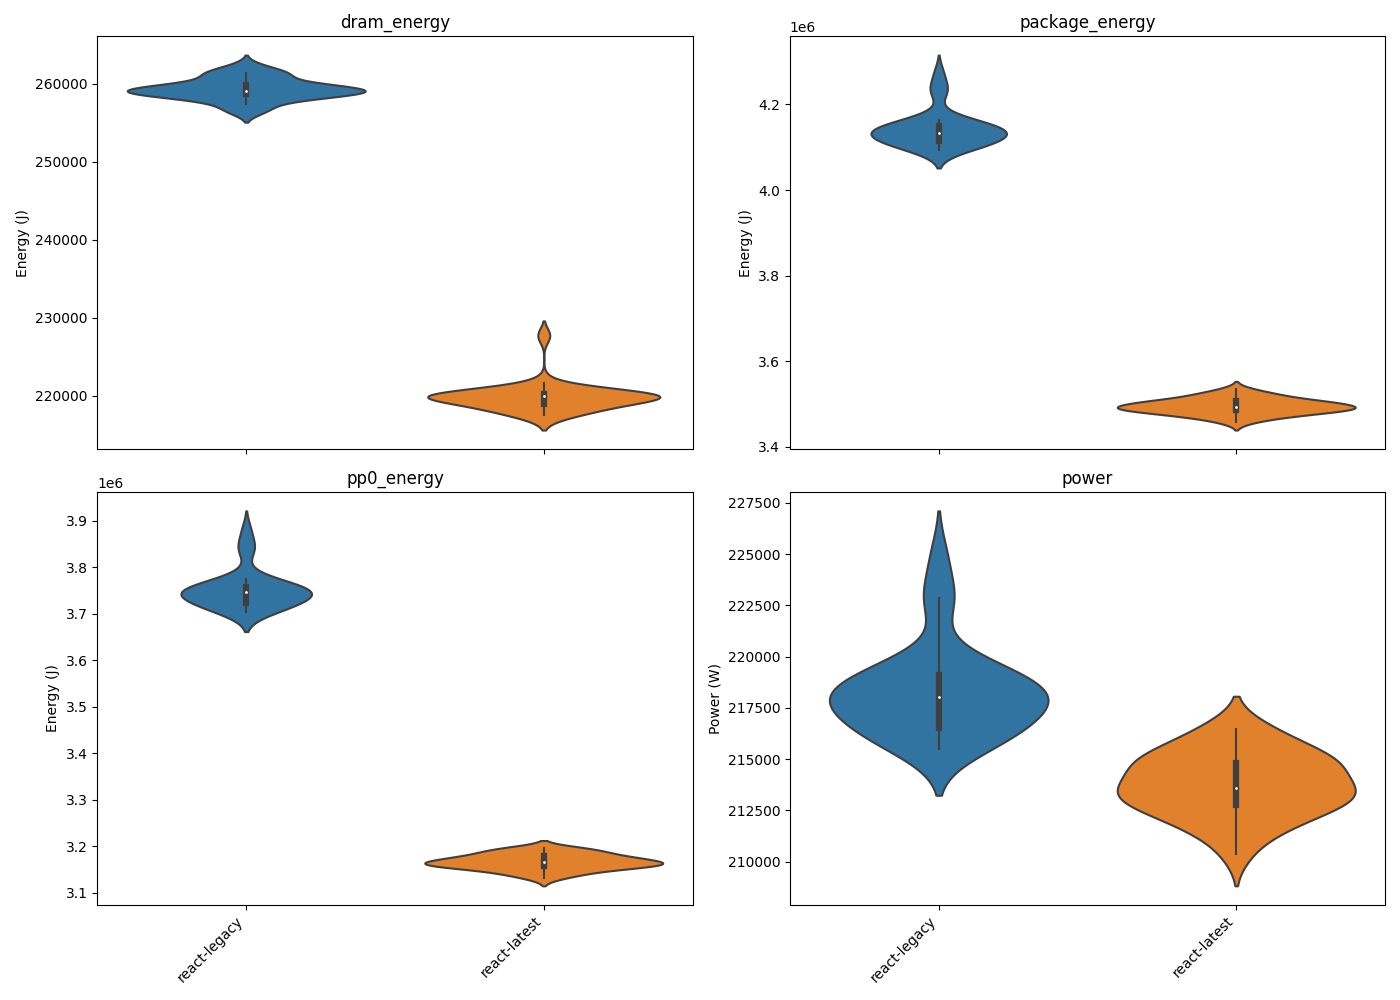
To determine the difference in energy consumption between both versions, we calculated the energy consumption for different components of the computer system. We computed the following violin graph, to show the distribution of 30 data points over the 2 versions across 4 categories. This shows us that distributions of the dram_energy, package_energy and pp0_energy significantly differ from one another. The latest version of React in this case requires significantly less energy across these 4 categories. In most graphs, we have a few upward outliers that can be attributed to external processes simultaneously running on the computer.

Figure 1: Violin plots on energy and power consumption
Energy Delay Product
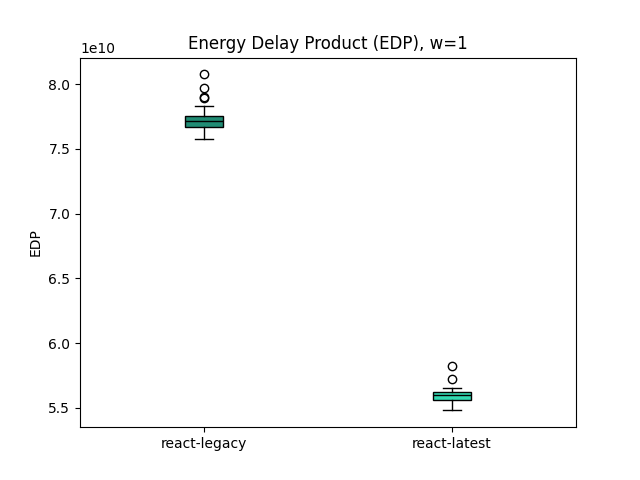
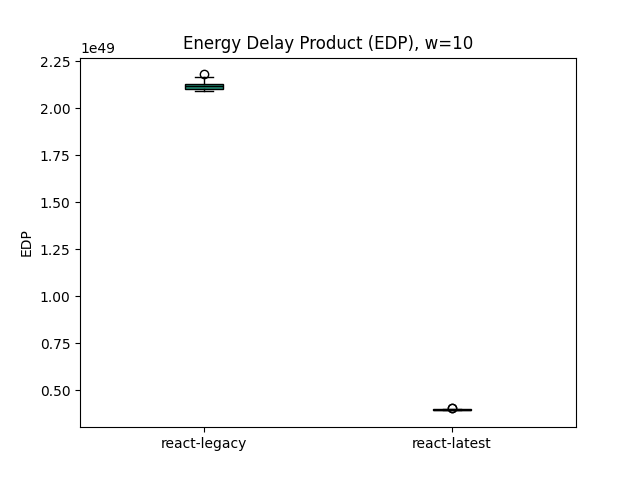
To also account for the runtime in combination with the energy consumption, we computed the Energy Delay Product, which resulted in the following graph. It shows a big difference between the two distributions. These differences become more profound by correcting more harshly for higher runtimes, using a w = 10.


Figure 2: Bar plots showing Energy Delay Product (EDP), for w=1 & w=10
Analysis
During the exploratory data analysis phase, we perform the Shapiro-Wilk test to determine whether the data is distributed normally. Due to outliers not all metrics resulted in normally distributed data, this can be seen in the table below.
| dram_energy | package_energy | pp0_energy | power | |
|---|---|---|---|---|
| react-legacy | 0.447544 | 0.000195 | 0.000187 | 0.001806 |
| react-latest | 0.000001 | 0.995079 | 0.736521 | 0.090655 |
Table 2: P-values for Shapiro-Wilk test (p < 0.05: not normally distributed)
After removing the outliers, which often occur during the measurement of energy consumption, the Shapiro-Wilk test returned values above 0.05 for all metrics. We used these datasets without outliers in the experiments below.
The next step is to determine if a statistical significance exists between the energy measurements, for which we use Welch’s t-test. This returns two different values; the t-statistic and a p-value. The t-statistic measures the size of the difference between groups relative to the variability within groups. The p-value quantifies the probability of observing said difference (or more extreme) between groups if there is no true difference in the population.
| dram_energy | package_energy | pp0_energy | power | |
|---|---|---|---|---|
| t-statistic | 91.0856 | 75.1750 | 69.7902 | 12.2920 |
| p-value | 1.075e-57 | 9.091e-42 | 9.892e-40 | 2.914e-17 |
Table 3: P-values for Welch’s t-test (p < 0.05: unequal means).
As one can see within the table above, the t-statistic values imply a significant difference in the means of the samples, which is visible within the violin plots. As t-statistics don’t necessarily say anything by themselves, the p-values indicate the probability for this data distribution to occur, given that both samples are drawn from the same distribution. As the p-values correspond directly to a probability, one can assume that these near-zero p-values indicate that a significant difference exists between the two sets of data points.
The next step is to measure the difference between the two samples, for which we will calculate a percentage change of means and Cohen’s D. In the table below one can see the changes in mean between the different energy types when comparing the legacy version and the latest version. For all energy types, a steep decrease in energy usage occurred of roughly 20%, compared to a decrease of 2% when considering power.
| react-legacy | react-latest | %-change | |
|---|---|---|---|
| dram_energy | 259313 | 219867 | -17.94% |
| package_energy | 4142773 | 3495200 | -18.52% |
| pp0_energy | 3752091 | 3166475 | -18.49% |
| power | 218288 | 213782 | -2.107% |
Table 4: Percentual change in mean
Below one can see the values for Cohen’s D for all energy types. As the mean differences are significantly large for each energy type and a difference exists between the mean power, one can assume that the values of the Cohen’s D will reflect this. As Cohen’s D increases, the relative difference between the samples increases as well, and thus the high values indicate that a significant change occurred between the two data distributions.
| dram_energy | package_energy | pp0_energy | power | |
|---|---|---|---|---|
| Cohen’s D | 24.79 | 20.46 | 18.99 | 2.416 |
Table 5: Cohens’ D, between react-legacy and react-latest
Discussion
We have shown that new releases of the React framework significantly reduce the power consumption of an application that loads a large dataset into a table. This remains true for all facets of the processor, the dram_energy and package_energy.
It not only led to a decrease in power consumption, but the latest version of React also resulted in lower runtimes, as can be seen in the graphs relating to the EDP, by increasing the w (weight) of the runtime.
This can be attributed to the fact that legacy React uses class components in contrast to modern React’s functional components. These perform the same calculations but get to this point by fundamentally different processes. These changes can also be attributed to the internal changes React made to its core rendering model in React 18. This included Concurrent React, which allows for multiple versions of the same UI running in the background.
This could be an indication that it could be very worthwhile for developers to quickly upgrade their applications to the newest React versions. Not only for the sake of being able to use the newest feature but also for environmental and financial reasons. For smaller websites, these small differences in power consumption may not make all the difference, but for large highly tracked websites, small improvements in loading large datasets could mean huge improvements in power consumption. Which not only for environmental reasons but also for financial reasons can be extremely beneficial.
Further research & limitations
Our research was currently only conducted on one machine, for one operating system. This makes it harder to generalize the results of this research. Furthermore, a single laptop does not necessarily accurately describe the way most websites are hosted. Additionaly only one webbrowser was evaluated which influences the results due to the browser specific handling of each webpage.
One of the big obstacles is keeping external factors constant whilst running the experiment. Whilst we tried to keep those to a minimum, there are data points corrupted by external factors creating extra power consumption. This could be due to connectivity issues, or other programs running in the background, pinpointing the exact issue, remains extremely hard in this field of research.
Further research should look into different forms of web applications, and the effect of power consumption between those versions. Other Javascript frameworks should in this case also be included in this research. As a benchmark vanilla Javascript could also be researched to further investigate the degree of overhead these Javascript frameworks produce.
Further research should also look into different features of websites. Currently, we only looked into loading large datasets into tables. It would be interesting to look into other power-consumption-heavy tasks, such as loading videos and images. It would also be interesting to look into more recent versions of React, such as React 15, which is more widely used than React 14, and whether or not there are huge changes between this version and the latest version.
-
Allianz Research - More emissions than meet the eye: Decarbonizing the ICT sector ↩
-
Zifera - Why you should care about the CO2 emissions of your website? ↩
-
Green and Sustainable JavaScript a study into the impact of framework usage ↩
-
w3techs - Usage statistics and market share of React for websites ↩
-
w3techs - Usage statistics and market share of React Version 15 for websites ↩