Comparing Energy Consumption of Integrated Development Environment
Rutger Doting, Nils van den Honert, Zeger Mouw.
Integrated development environments (IDEs) play a key part in the current software development landscape. However, very little is known about the energy consumption of these IDEs. This makes it difficult for the environmentally conscious developer choose the most energy-friendly IDE. This why we chose to compare two of the most popular IDEs, IntelliJ and Visual Studio Code. We found that Visual Studio Code is the best for reduced battery usage and a reduced carbon footprint. Thus, we recommend that the environmentally conscious developer should choose Visual Studio Code
Introduction
Programming is mostly done now via integrated development environments, also known as IDEs. In order to pivot towards lower carbon footprints and a reduced environmental impact, an environmentally conscious developer might want to choose an IDE that has a lower energy consumption. Next to the positive environmental impact, this could also have significant benefits to the UX of developers that work remotely frequently. Batteries have finite capacity and most computers are not able to go a day without being plugged in for charging. Extending the amount of time a developer can code is therefore important, and using a lightweight IDE for running code can be crucial. This could also amount to a substantial reduction in carbon footprint, since developers spends non-trivial amounts of time using these IDEs. To guide environmentally aware developers, we set up a series of experiments that allow them to make a research-backed decision on which IDE to use.
For the IDEs, we have decide to test the Visual Studio Code and IntelliJ IDEs. Specifically, we have opted to compare the 2022 versions, with Visual Studio Code 2022 17.4 and IntelliJ IDEA 2022.3. Visual Studio Code is an IDE from Microsoft and helps the user with programming by provide code completion, code refactoring, design options and a host of other functionalities.1 It is the most popular option for developers, with 71% of developers stating that they used Visual Studio Code over 2021.2
IntelliJ, which is frequently used by 29% of developers over 20212, is an IDE that has been specifically developed for JVM-based languages, such as Java and Kotlin. It is developed by JetBrains and was first released in 2001. It too features code completion and code refactoring capabilities and is complemented by a rich plug-in environment.
In this blog, we will explore the energy usage of both IDEs. This will be done by using the Intel Power Gadget as a measurement tool to estimate energy usage.
Measurement set-up
Testing process
To determine the differences between IntelliJ and Visual Studio Code, we set up an experiment where both programs had to run the same software. For this experiment, we use a Python and Java application that makes an array with random numbers and then sorts that array. Furthermore, both programs had to run a Node.js server for 10 seconds.
To ensure we could test the differences between the programs, we used the same environment during the tests. This means that there are no other programs open, the laptop is connected to a power source and the parameters of the experiment are the same.
The experiments are run through a bat file. This bat file executes the Intel Power Log 10 times for each program-software pair. This results in 60 experiments. Each run calls the following function:
PowerLog3.0.exe" -file (program)_(software)%loop%.csv -cmd python main.py (program) (software)
The PowerLog keeps track of the energy consumption while the command main.py (program) (language) runs. The main.py starts the program (IntelliJ / Visual Studio Code) with the file with the corresponding language. Since running the software from an external command prompt is not possible, main.py waits till the program has started and then simulates key presses. IntelliJ and Visual Studio Code use diffent keyboard shortcuts. The software in Visual Studio Code can be run by pressing Ctrl + Alt + N. This is possible because of the extension Code Runner. In IntelliJ, this is not possible. In IntelliJ, the terminal can be opened by pressing Alt + F12. This is done after IntelliJ has loaded the file. When a confirmation has reached the main.py, the command for running the file is pasted in the terminal and enter is pressed.
The Python, Java, and JavaScript files execute two sorting algorithms and a simple Node.js server. The code in these files closes the program automatically. This finishes the main.py, and therefore, the Powerlog stops monitoring. The results of the PowerLog are saved in a CSV file.
The code for these automated experiments can be found on the Github repository.
Hardware set-up
The experiments were run on a laptop with the following specifications:
| Laptop | Lenovo ThinkPad E15 |
|---|---|
| CPU | Intel(R) Core(TM) i7-10510U |
| RAM | 16 GB |
| GPU | AMD Radeon (TM) RX 640 |
| OS | Microsoft Windows 11 Pro |
Results
The experiments can be found on the Github repository. We have split our energy consumption into three parts: the energy used by the CPU, the energy consumed by the GPU and the energy used for our RAM. The result per category for a specific language can be found below in the boxplots. In each section of the results a combination of an IDE and a language is explored. There we check whether the distribution is normal using a boxplot and the Shapiro-Wilk test.
Python
 |
|---|
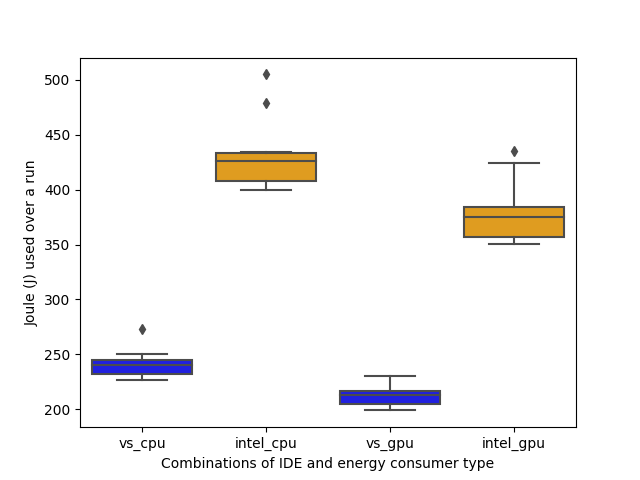
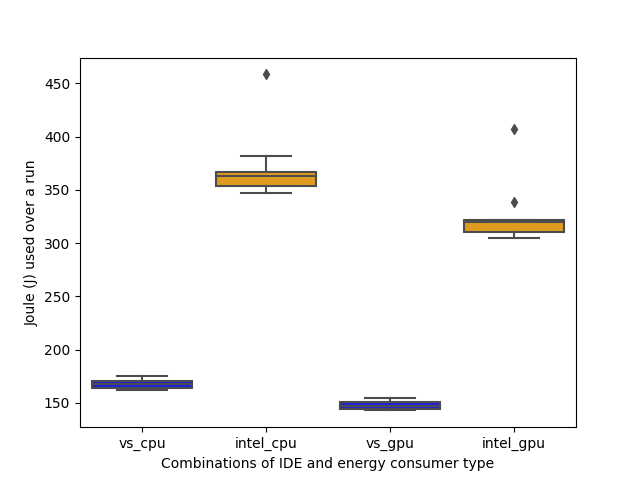
| Figure 1: CPU/GPU comparison for Python code |
 |
|---|
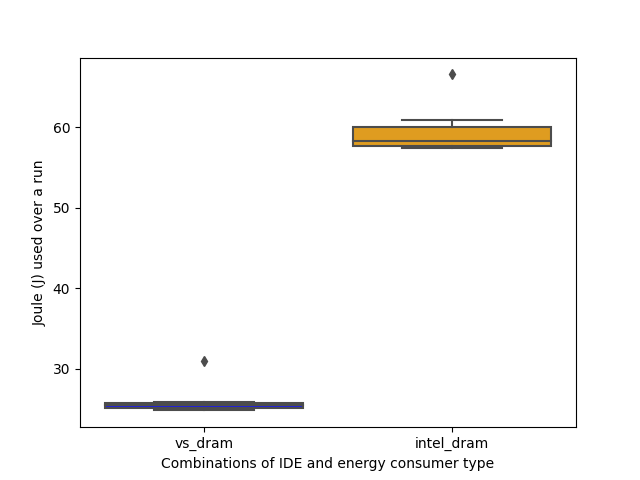
| Figure 2: DRAM comparison for Python code |
Visual Studio Code
The boxplot of running a Python application in Visual Studio Code shows no outliers and exhibits a pattern that indicates a normal distribution as well. If we perform a Shapiro-Wilk test, we get a p-value of 0.875, which confirms our theory that the data is normally distributed. That means we can expect a program to use 239 J of energy for a run on average. Energy usage typically ranges from 230 to 245.
With the GPU energy consumption, we see a similar pattern. The boxplot shows a similar distribution of values, although the scale is different on the y-axis. This indicates that the data that we have collected matches a normal distribution. This is confirmed by our Shapiro-Wilk test, which returns a p-value of 0.840. While this does not guarantee that the data is a normal distribution, all the signs we look for are pointing in this direction. The average energy usage is roughly 212 Joules.
Lastly, we can observe the RAM energy usage over the different runs. Here, the average is more centered within the box plot. This still seems like valid distribution and could be considered normal. Upon running the Shapiro-Wilk test, we get a p-value of 0.430, which does not disprove our hypothesis. So we consider this to be a normal distribution, which averages our energy consumption at 25.5 J.
IntelliJ
Upon examining the IntelliJ CPU energy usage for the Python application, we see that the distribution shape is a bit different. The boxplot contains an outlier. If we look at the data, there is one outlier that is significantly higher than the others. This run has a value of over 500 J. Since this only happens in the first run, it could be that some other process happened to interfere at the first run of the distribution. Upon further inspection of the data, the application seems to run longer on the first run than on other runs. It took 48 seconds for its first run, where other runs average around 42 seconds. The stalling of this run seems to explain its higher energy consumption quite well, so it is best excluded from our estimation. However, running the statistical analysis shows us that the p-value still reaches 0.083, which means the statistical test still does not reject the hypothesis that this is a normal distribution, even with the outlier. So while the outlier could be removed, we still include it in our average, which would result in an expected energy consumption of 422 J per run for the CPU.
For the GPU, we can see it is also influenced by the first run as an outlier. Here, the difference is more apparent. This, the Shapiro-Wilk test does not reject the hypothesis at a value of 0.107. We can still assume this data to be normal. The shape does however still match a normal distribution, even though we can only see one tail. This graph shows us the average consumption would be around 370 Joules per run done for the GPU.
For its DRAM energy consumption, we see something different happening. The first run again seems to influence the results strongly. Once we remove this run from the data, we get an even lower p-value of 0.02 versus 0.04 with the outlier. It seems that the DRAM behaviour is not centered around a normal distribution.
Java
 |
|---|
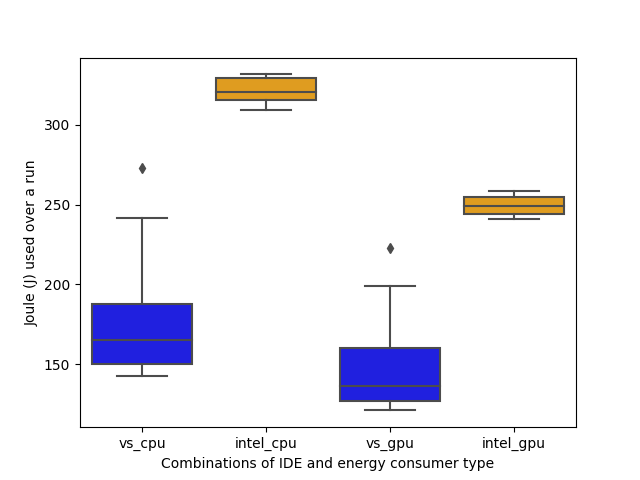
| Figure 3: CPU/GPU comparison for Java code |
 |
|---|
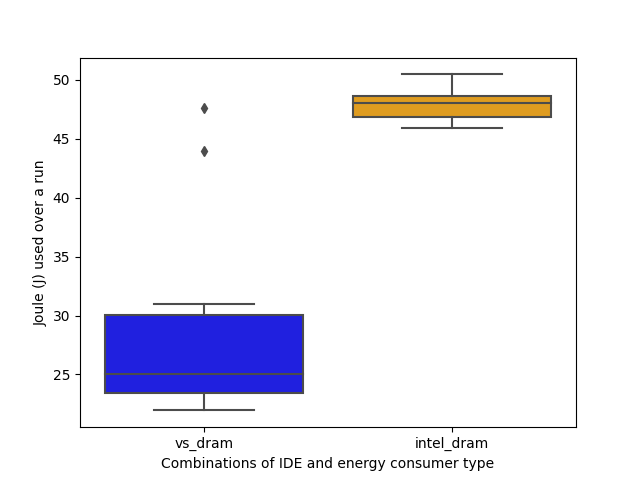
| Figure 4: DRAM comparison for Java code |
Visual Studio Code
For the Java experiment in Visual Studio Code, we can again see an outlier in the boxplot. If we take a look at the runs, we can see that there are two values that are significantly higher than the others, which are 273 and 241. These do not happen at the start of the run, but seems to happen in runs that are neither close to the first or last experiment. What these do have in common is that they run for a lot longer than other runs, both upwards of 20 seconds compared to 15 seconds for other executions. If we exclude these runs, the data does seems to behave according to a normal distribution. The average however with these is 160 J for the CPU.
If we evaluate the GPU data for Visual Studio Code for the Java experiment, it matches the pattern we observe in the CPU data. The Shapiro-Wilk test reject the hypothesis as well, with a p-value of 0.02. The same data points that heavily influence the CPU data are also different in the GPU data. In these runs the GPU consumes upwards of 200 J of energy, versus around 130 J for the runs that finish earlier than 20 seconds. On average however, they consume 133 J of energy.
This again holds for the DRAM data. Here the outliers are distinctly present on the boxplot, with values at 48 J and 44 J. The Shapiro-Wilk also reject the normal distribution with a p-value of 0.01. The average ends up with the outliers at around 26 J.
IntelliJ
In IntelliJ, the data is not indicative of anything other than a normal distribution. This is also seen in the p-value, which is returned to be 0.39. This means that an expected energy consumption of 322 J on average is a consistent measurement over our runs, with little variation to be seen in both distributions.
JavaScript
 |
|---|
| Figure 5: CPU/GPU comparison for JavaScript code |
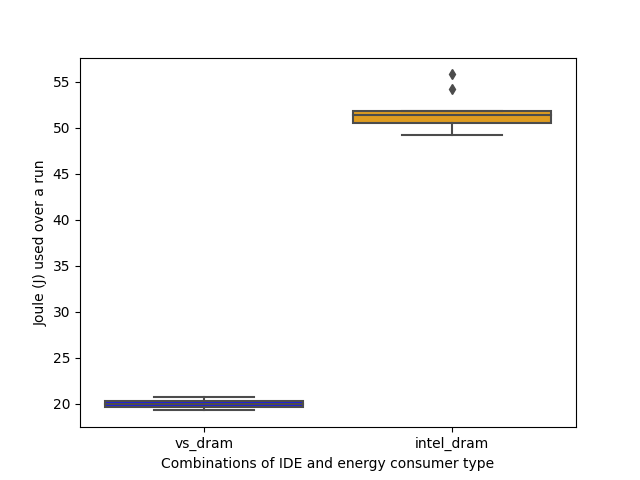 |
|---|
| Figure 6: DRAM comparison for JavaScript code |
Visual Studio Code
Based on the boxplot, which shows no outliers and has its mean in the center of the distribution, we assume that the data is distributed normally. This is confirmed by the p-value from the Shapiro-Wilk test, which returns a value of 0.74. These factors indicate that the program has a predictable average energy consumption, which hovers around 168 J for the CPU.
For the GPU, the p-value of the Shapiro-Wilk test does not reject the hypothesis. This would make it acceptable for us to assume the data is distributed normally, which would in turn indicate that the experiment has run successfully. The average value we would get is around 149 J.
Lastly, for the DRAM, we get a p-value of 0.97, which would indicate that the distribution is normal. This on average takes about 20 J of energy. The boxplot confirms together with the test that it is okay to assume a normal distribution on the data.
IntelliJ
For the CPU, we can see a clear outlier in the data. This also results in a rejection of the hypothesis, since we get a value of 0.0004. Without this outlier, the data gets a p-value of 0.46 on the Shapiro-Wilk test. If we remove the outlier, this results in an average energy consumption of 360 J.
A similar situation can be detected in the GPU, where we can see that the hypothesis of a normal distribution is rejected as well, because of this outlier. It also returns a p-value lower than our alpha threshold, with a p-value of 0.0007. The average ends up at around 320 J.
Finally, for the DRAM, we can see that the outlier has a reduced impact on our hypothesis. There is a smaller difference when we compare this outlier to the outliers of the CPU and GPU. This also allows for the hypothesis to not be rejected, since p = 0.057. However, this value still increases the average significantly to 51 J.
Discussion
In all plots shown above, it can be seen that the average energy consumption of Visual Studio Code is lower than IntelliJ. This is seen very clearly for the CPU and GPU energy consumption, where the difference is typically over 100 J over this time span. In order to validate that these results are statistically significant, we decided to run a Student’s t-test in order to ensure that the results are valid.
The results of these tests are all clear of the alpha threshold, ranging from 5.0e-6 to 1.1e-20, which show that the distributions are different Its practical significance is clear. Even in terms of DRAM, the result show that the relative consumption of IntelliJ is higher than its Visual Studio Code usage. While 100 J does not seems large, these experiments are run over short time spans, typically less than 30 seconds. If we extrapolate the 100 J difference, which is multiplied by 2 since both the CPU and GPU usage exhibit this difference, it would equate to 200 J / 0.5 m = 6 W. With this particular laptop, which has a battery of 45 Whr, this means that a 6 W difference has great benefits for the developer, as it contributes to less battery usage. Thus, we can conclude that the energy consumption of Visual Studio Code is lower, which is what we hypothesised in our original proposal for the experiment.
Limitations and future research
Our research had a few limitations, which we will briefly discuss in this section.
One possible limitation of our research is the fact that the tests were only performed on one system, as specified in the hardware set-up section above. While this ensures that the results of the different tests are easily comparable, it also makes it harder to generalize our results.
This project had a time span of a week. Therefore, the software may not be perfectly optimised. For example, it is possible that the code that closes Intellij and Visual Studio Code only closes the window, but not the background processes of the software. This could have influenced the speed of the next start up.
For each program/software combination, we executed the experiment 10 times. However, these 10 similar experiments were executed in a row. This could result in e.g. IntelliJ closing down and immediately starting back up. This could have influenced the results since data from the software could still be active in the RAM.
Furthermore, we tried to execute the experiments as humanlike as possible. This means that the experiments were run in a normal Microsoft Windows environment with background processes on. These background processes could have influenced the final outcomes.
Lastly, one could argue that running code is not the only thing a developer does with an IDE. A substantial amount of time is spent writing, reading and debugging. In future research, one could expand on this knowledge by testing an idle mode or simulating a developer that writes code.
Conclusion
In this blog, we analysed and compared the energy consumption of two of the most popular IDEs, Visual Studio Code and IntelliJ. We tested the energy consumption by running a Python application a Java application, and a Node.js server. These tests simulated real life user behaviour using an automated script that mimics user clicks and keyboard usage. Based on the results of our tests, we found that Visual Studio Code uses significantly less energy than IntelliJ. Therefore, the recommendation is to use Visual Studio Code for reduced battery usage and a reduced carbon footprint.